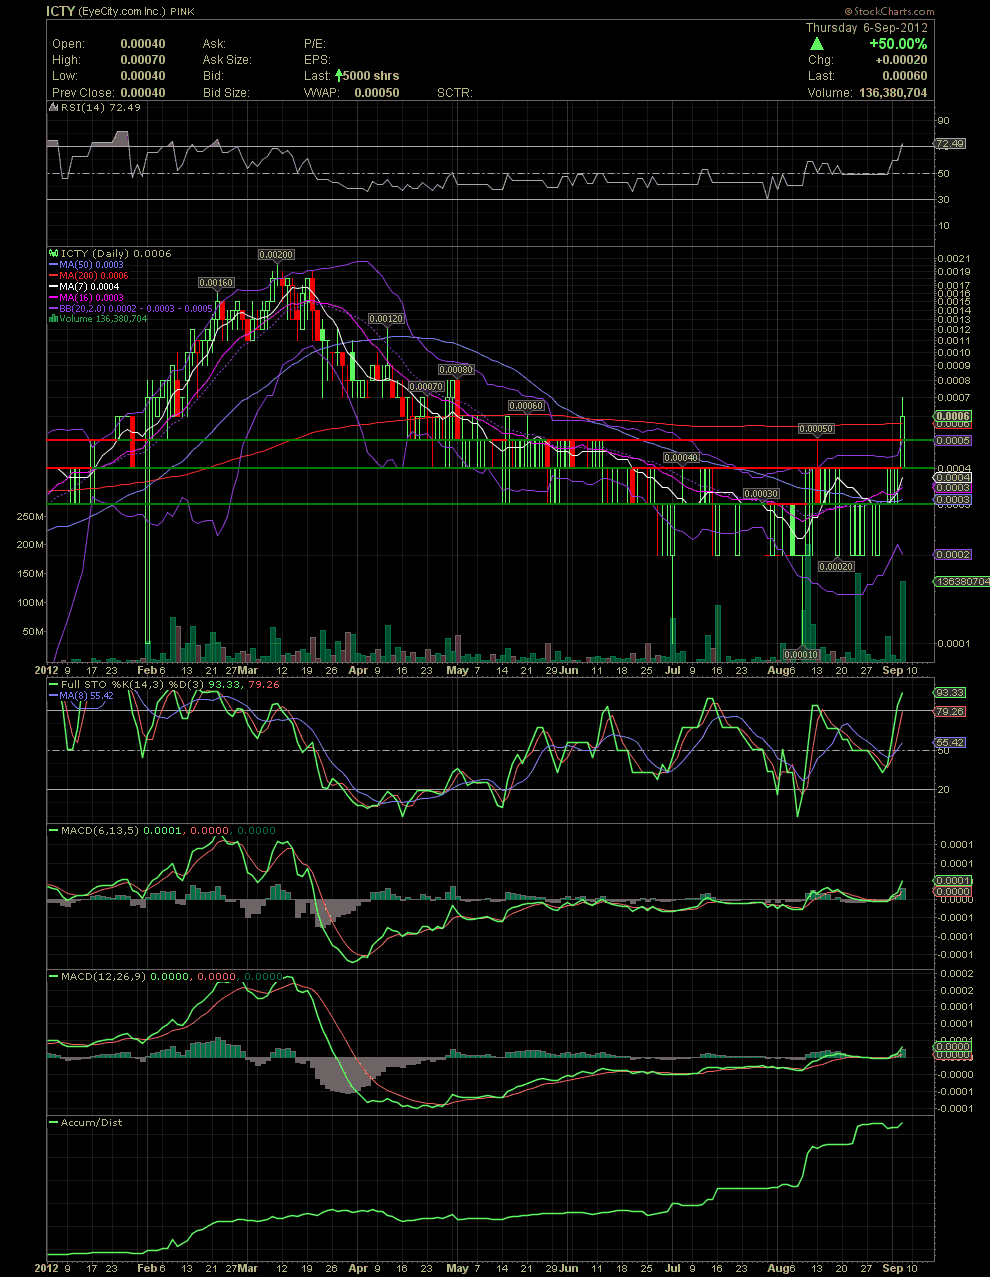
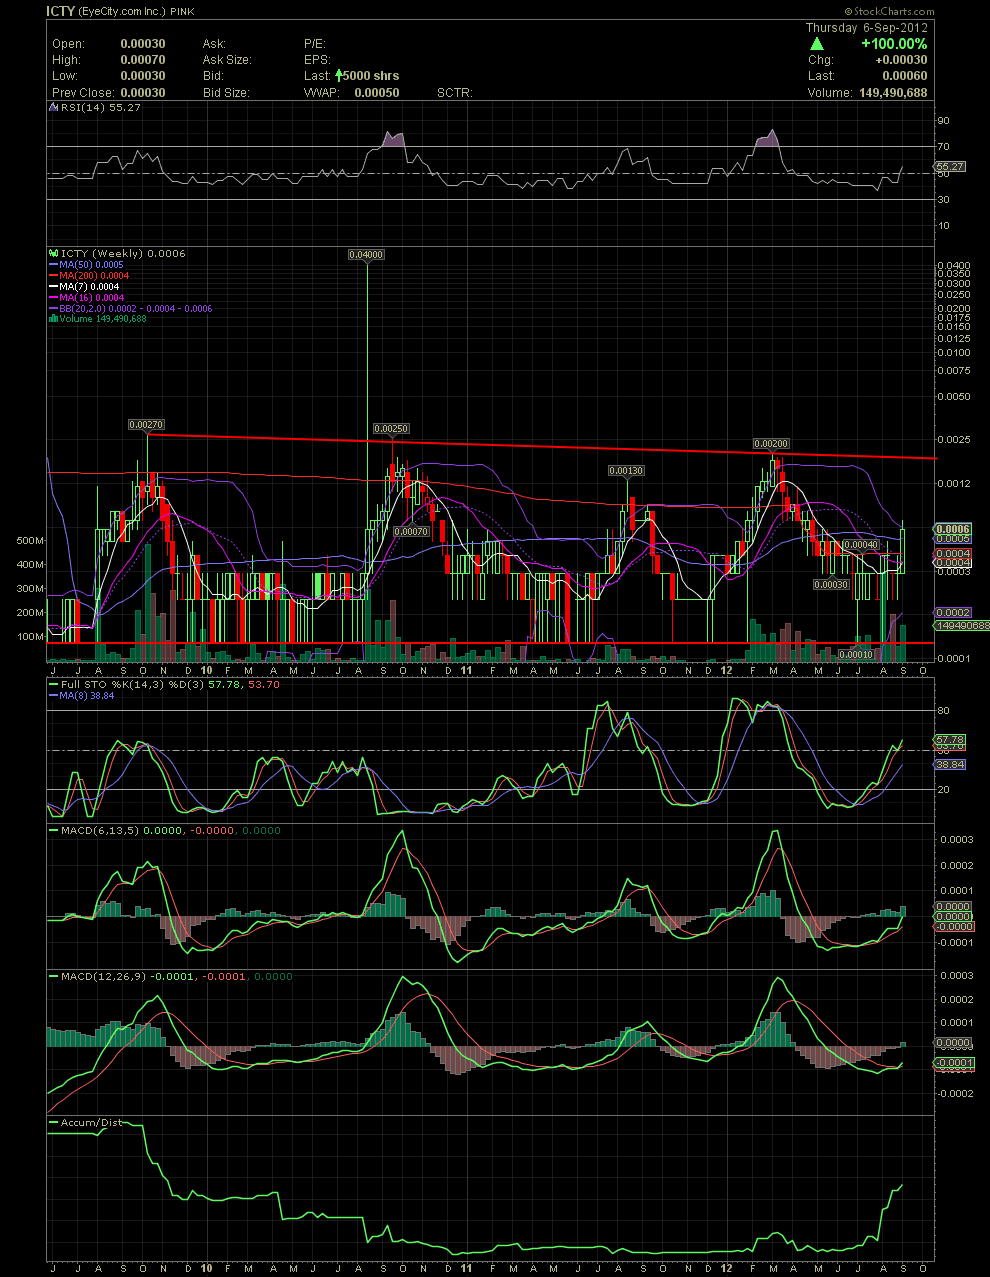
Here's what I sent out today after the close to my email group. I suggested aggressive accumulation about six weeks back for a slow and steady climb to .005-.01 based on an acquisition closing. There are two charts. The first is the daily and the weekly.
__________________
Good Afternoon Everyone,
Just a quick follow up on the recent ITCY charts of the last couple of weeks. The very large amount of shares that about 15 of us have accumulated (at least there's only 15 of you that have let me know that you've bought) is beginning to show what I had expected. The move above .0004 and .0005 (the horizontal resistance) was what I was hoping we would see today. With the stock closing at .0006 today on fairly strong volume, we are now just barely over the much watched MA200. The stock price got to .0007 before some backfilling and profit taking. A few of the pumping clowns on various message boards showed up today which almost immediately put a halt on the move. That's fine though, as it's good to get the short term flippers out of the way. The selling pressure began almost at the same time that the Capital Letters, Weeee's, To The Moon, and other pumping clown talk started. It's a good thing though, because as a few of the known flippers sold into today's 50% move, their shares were being accumulated by many of my friends that I converse with daily. It looks like a bit more than 80 mil shares were added by us today. That's a pretty decent total for one day. Our accumulation over the last month is clearly reflected on the A/D line on the chart below. And guess what? All that was done without one pumping clown knowing about it.
As to the chart now. As I mentioned above, the share price has moved up and over the MA200. The MA50 was broken when we saw the stock move to .0004. The MA7 has crossed over the MA16 and both are over the MA50. This is all strong indications that we should be moving much higher. Both of the MACD indicators I use are now in a by signal with clear separation. I mentioned the longer term RSI indicator a few days ago and stated that it was hanging on the 50 line. We are now entering a slightly overbought area over the 70 line in addition to the FullSto also being slightly overbought. That's why it was a good thing that the pumpers showed up today which signals that some selling and backfilling was about to occur. Although I would like to see the stock move quickly up and thru .001, it also wouldn't hurt things to see some consolidation here at .0005-.0007. Allow the short term profit takers to sell and move on while new investors take a position at these levels. More than likely, the newer investors won't be selling until they see 50-100% gains. My opinion, which I've shared previously, is that with any material news, I think the share price breaks into and over the .002s. Please check my email of this morning to view that 3 year chart.
Nice accumulating over the last few weeks for all involved. Those .0002s and .0003s are starting to look good. The .0004s too. Today's .0005s and .0006 should begin looking decent in a few more days.
Good luck to all and trade smart!
ICTY Daily
ICTY Weekly


 (0)
(0) (0)
(0)