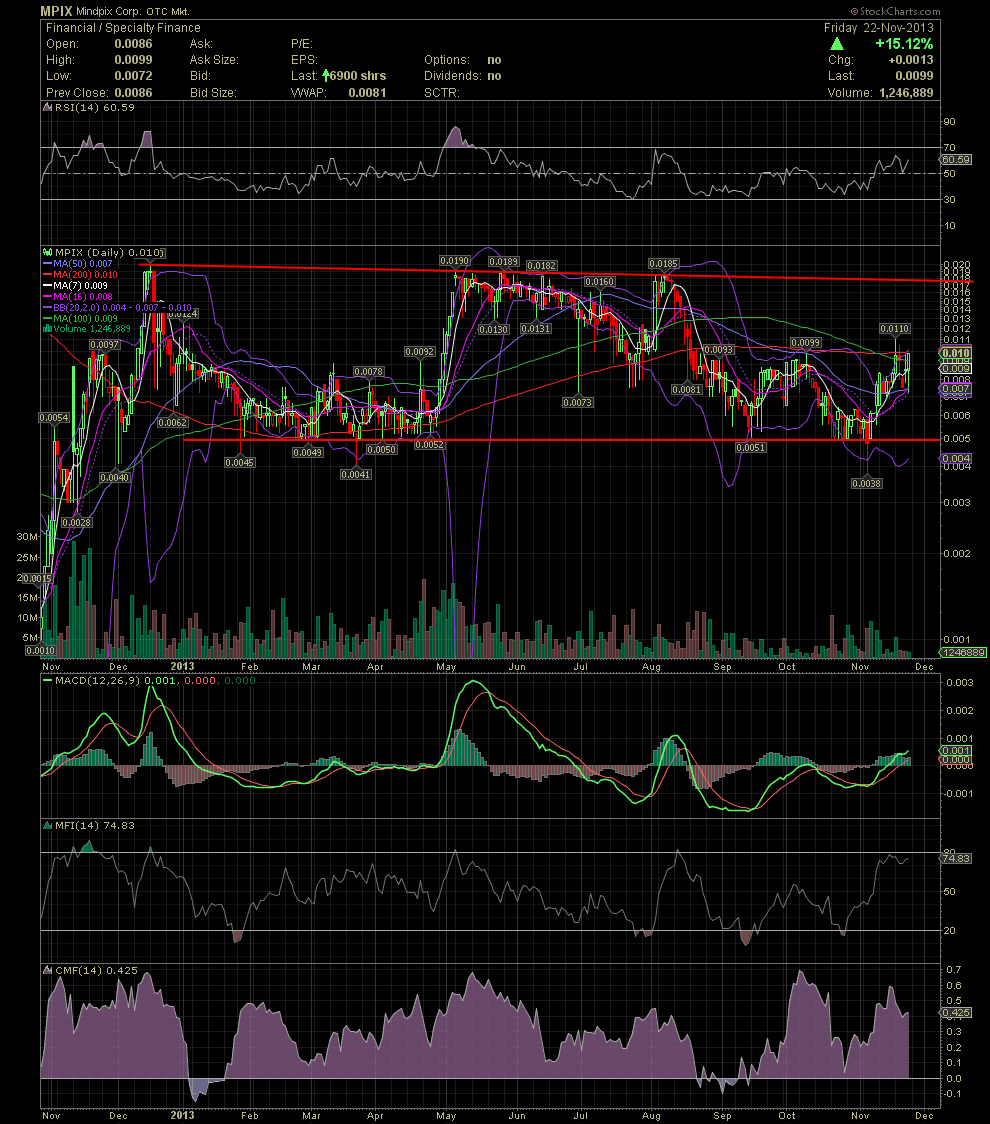
MPIX Daily Chart ~ The Longer Term Picture I alw
Post# of 2561

I always like to show the longer term chart, in this case a 14 month shot, as it clearly shows the support levels and resistance points since many of us began accumulating from the .000s. And a lot of those shares are going long term as every week passes. For some of us, that's more than 12 bags so far at long term capital gain rates. GLTA

 (0)
(0) (0)
(0)