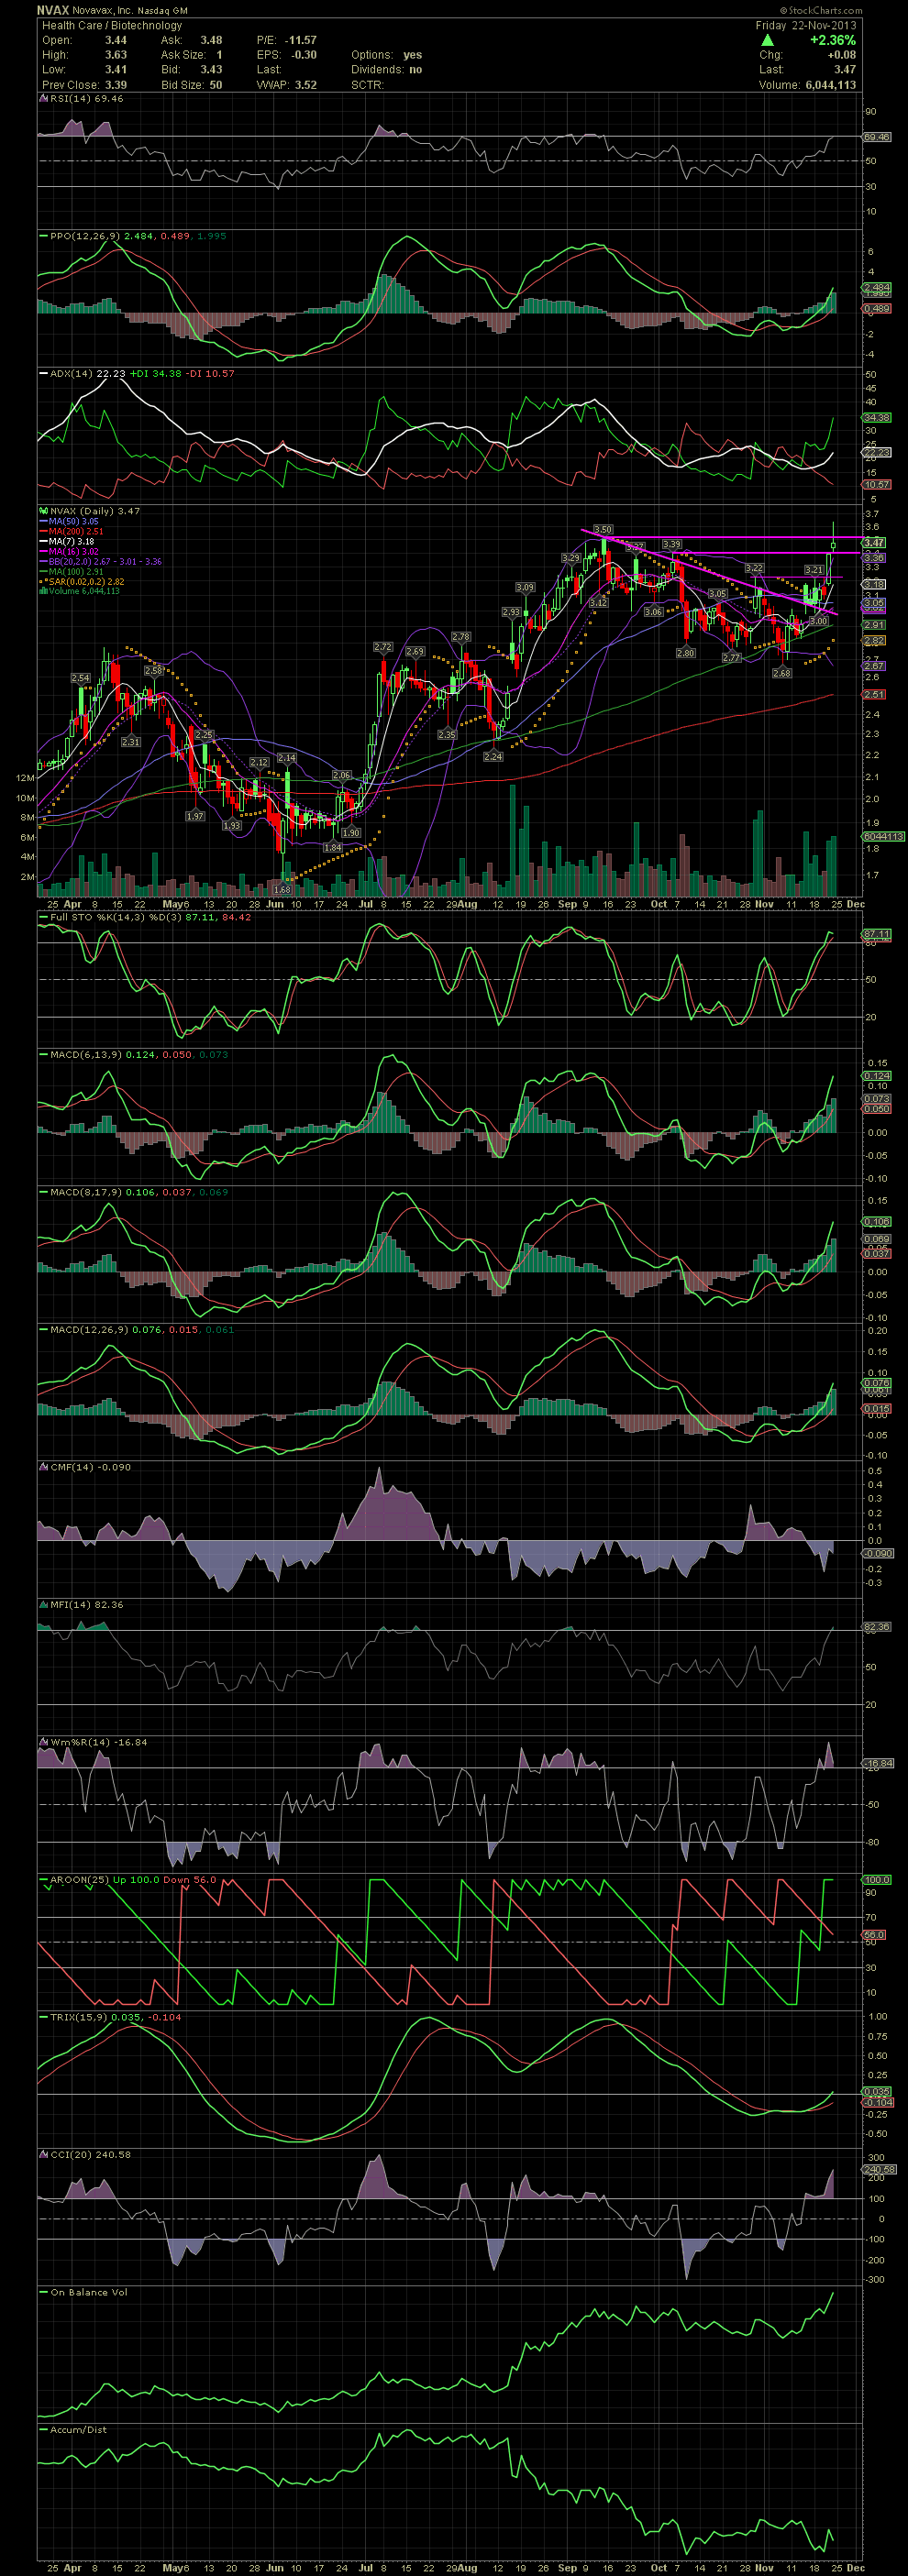
NVAX Daily Chart ~ Moving Higher Since Breaking th
Post# of 2561

A few of us entered NVAX last week when the declining tops line was taken out to the upside just over 3.00. Last week I mentioned the horizontal resistance points of 3.22 and 3.39. Once those were achieved, next up was 3.50. No surprise to me that the stock began to see profit taking at that level especially since the stock gapped up and was trading outside the upper bollie. I personally didn't sell, although in hindsight, the 3.60s would have been a quick .50 gain on an investment in the 3.10s just three days prior. I'll give NVAX a chance to close above the previous closing high of 3.50 as she would be Blue Skyin' for us. Immediate short term support would have to be that 3.36-3.39 level. So my sell button will be near by. One can always re-enter with funds on the sidelines. GLTA

 (0)
(0) (0)
(0)