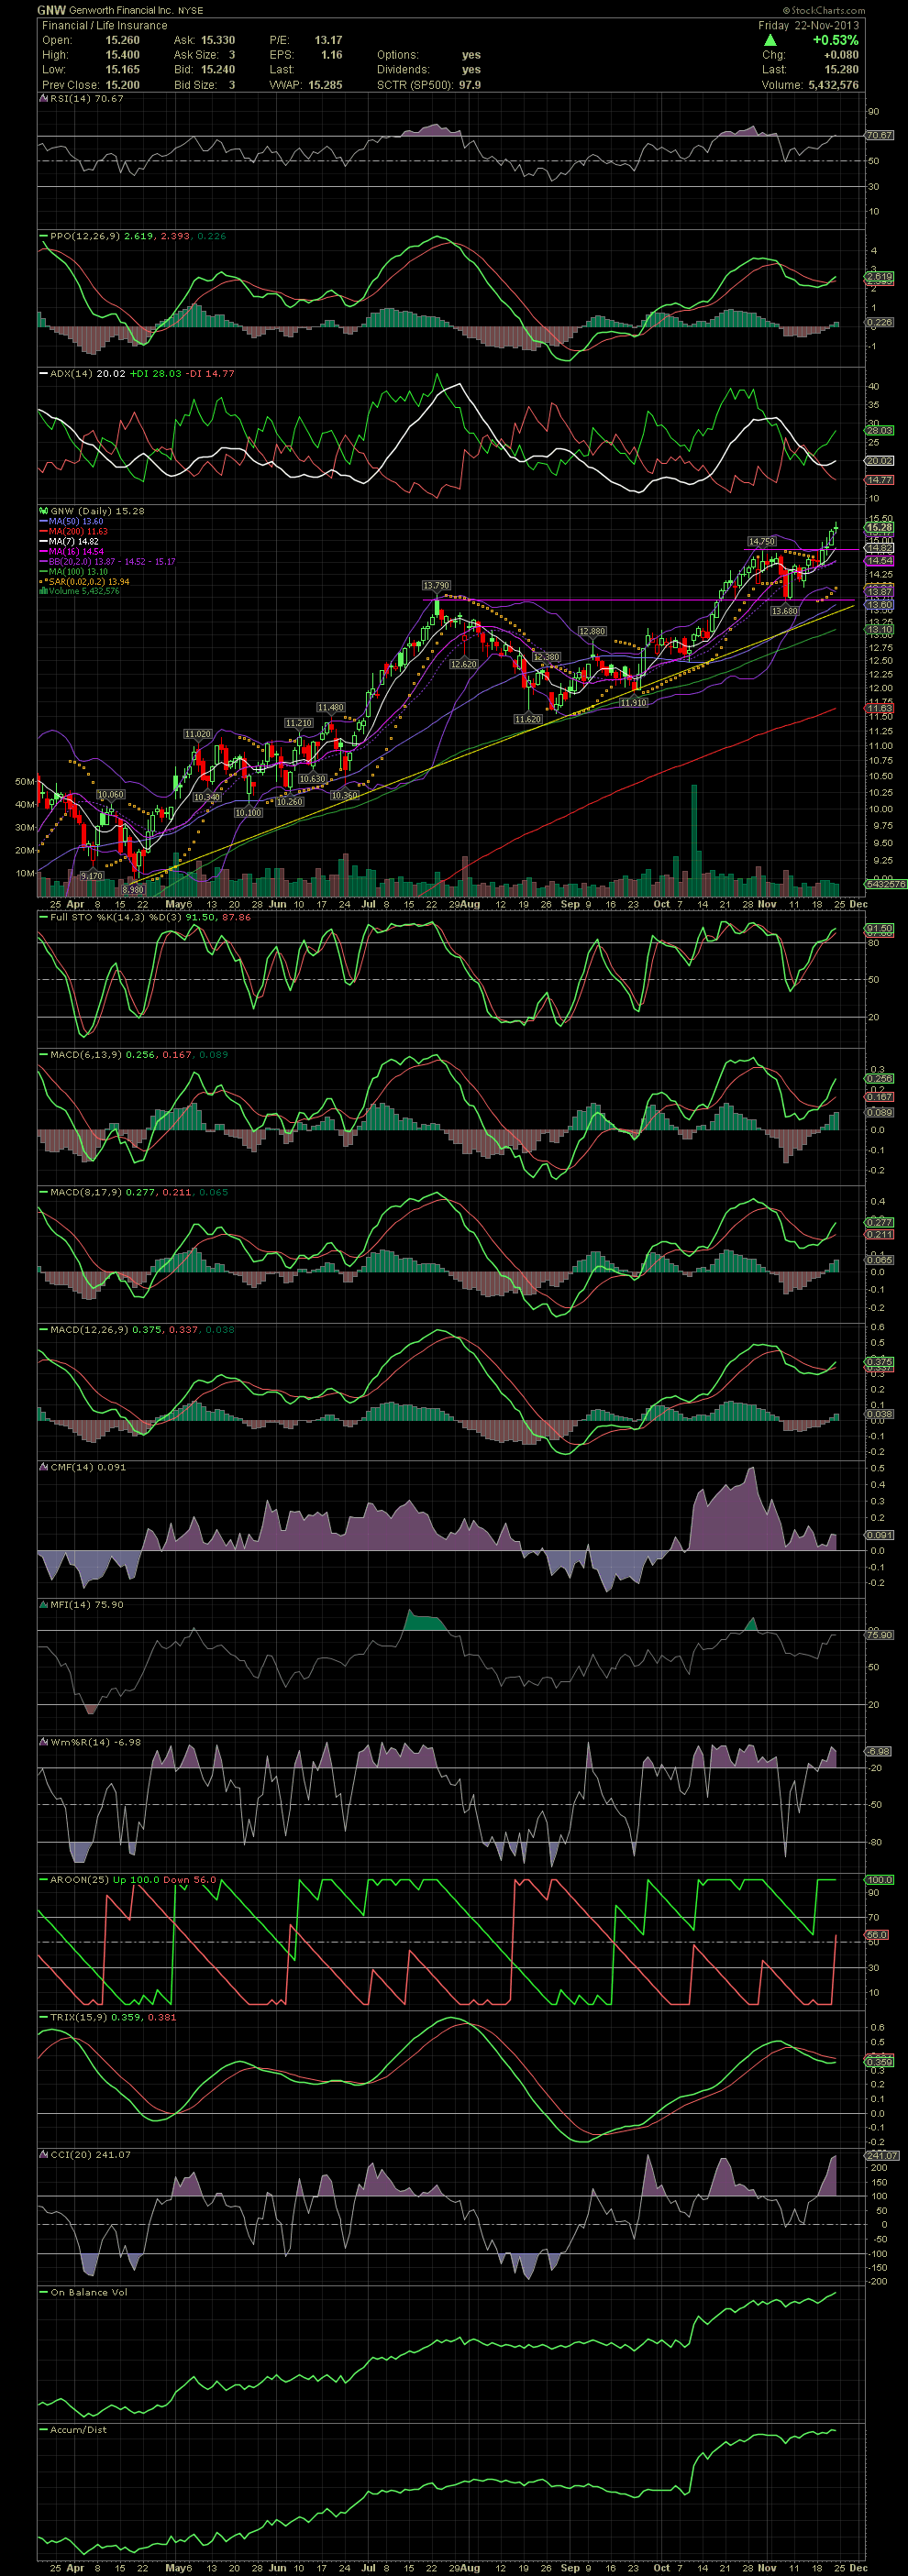
GNW Daily Chart ~ New Highs Hit This Last Week L
Post# of 2561

Last month I suggested you keep an eye on the previous high of 13.79. Our entries were in the high $12s and low $13s. After establishing a top at at 14.75 in late October, I was looking for some consolidation and another move up once that new high was hit. Over the last three days, GNW traded as high as 15.40. More coming based on what I see on the chart. The stock is now trading at its highest level since mid 2010. The next resistance point is 16.10 and then 1936. One would have to go back to early 2010 to see that on the chart. GLTA

 (0)
(0) (0)
(0)