GNW Daily Chart ~ Ready for a Continuation of the
Post# of 2561
Posted On: 11/17/2013 4:37:03 PM

GNW Daily Chart ~ Ready for a Continuation of the Multi Month Advance
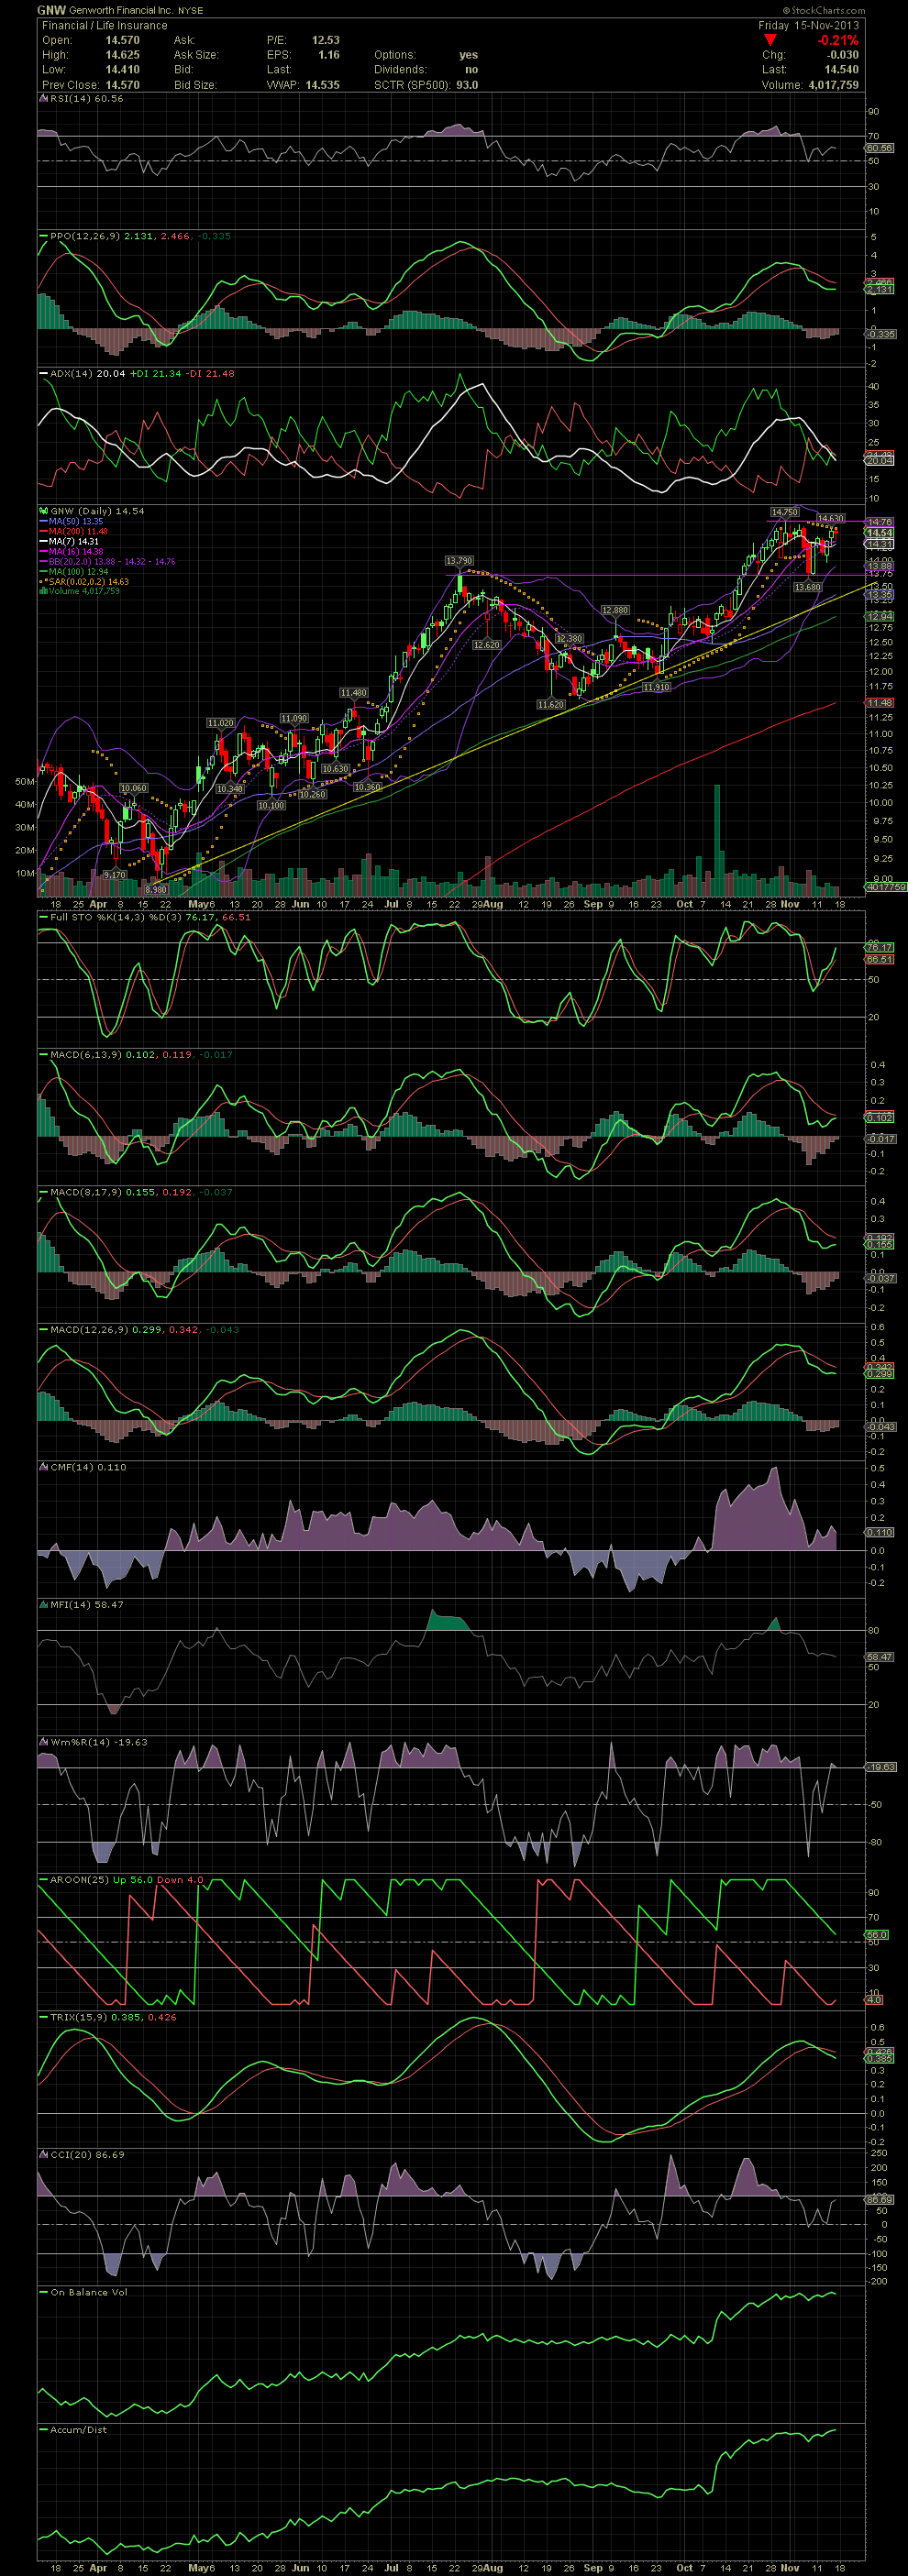
Yes, GNW is boring. But for the less speculative funds, this banking stock has treated us well. Earlier this month, the stock corrected and pulled back to the support of its previous top of July. GNW has since rebounded and is nearly breakout territory. A close over the 14.75 level would most certainly offer up some 15.00s and higher. A look at the Weekly Chart shows a previous high of 14.77 established in late Dec 2011. GNW is probably going much higher. Actually added in the mid 13.00s last month. Both the Daily and Weekly Charts are below. GLTA
GNW Daily Chart
GNW Weekly Chart
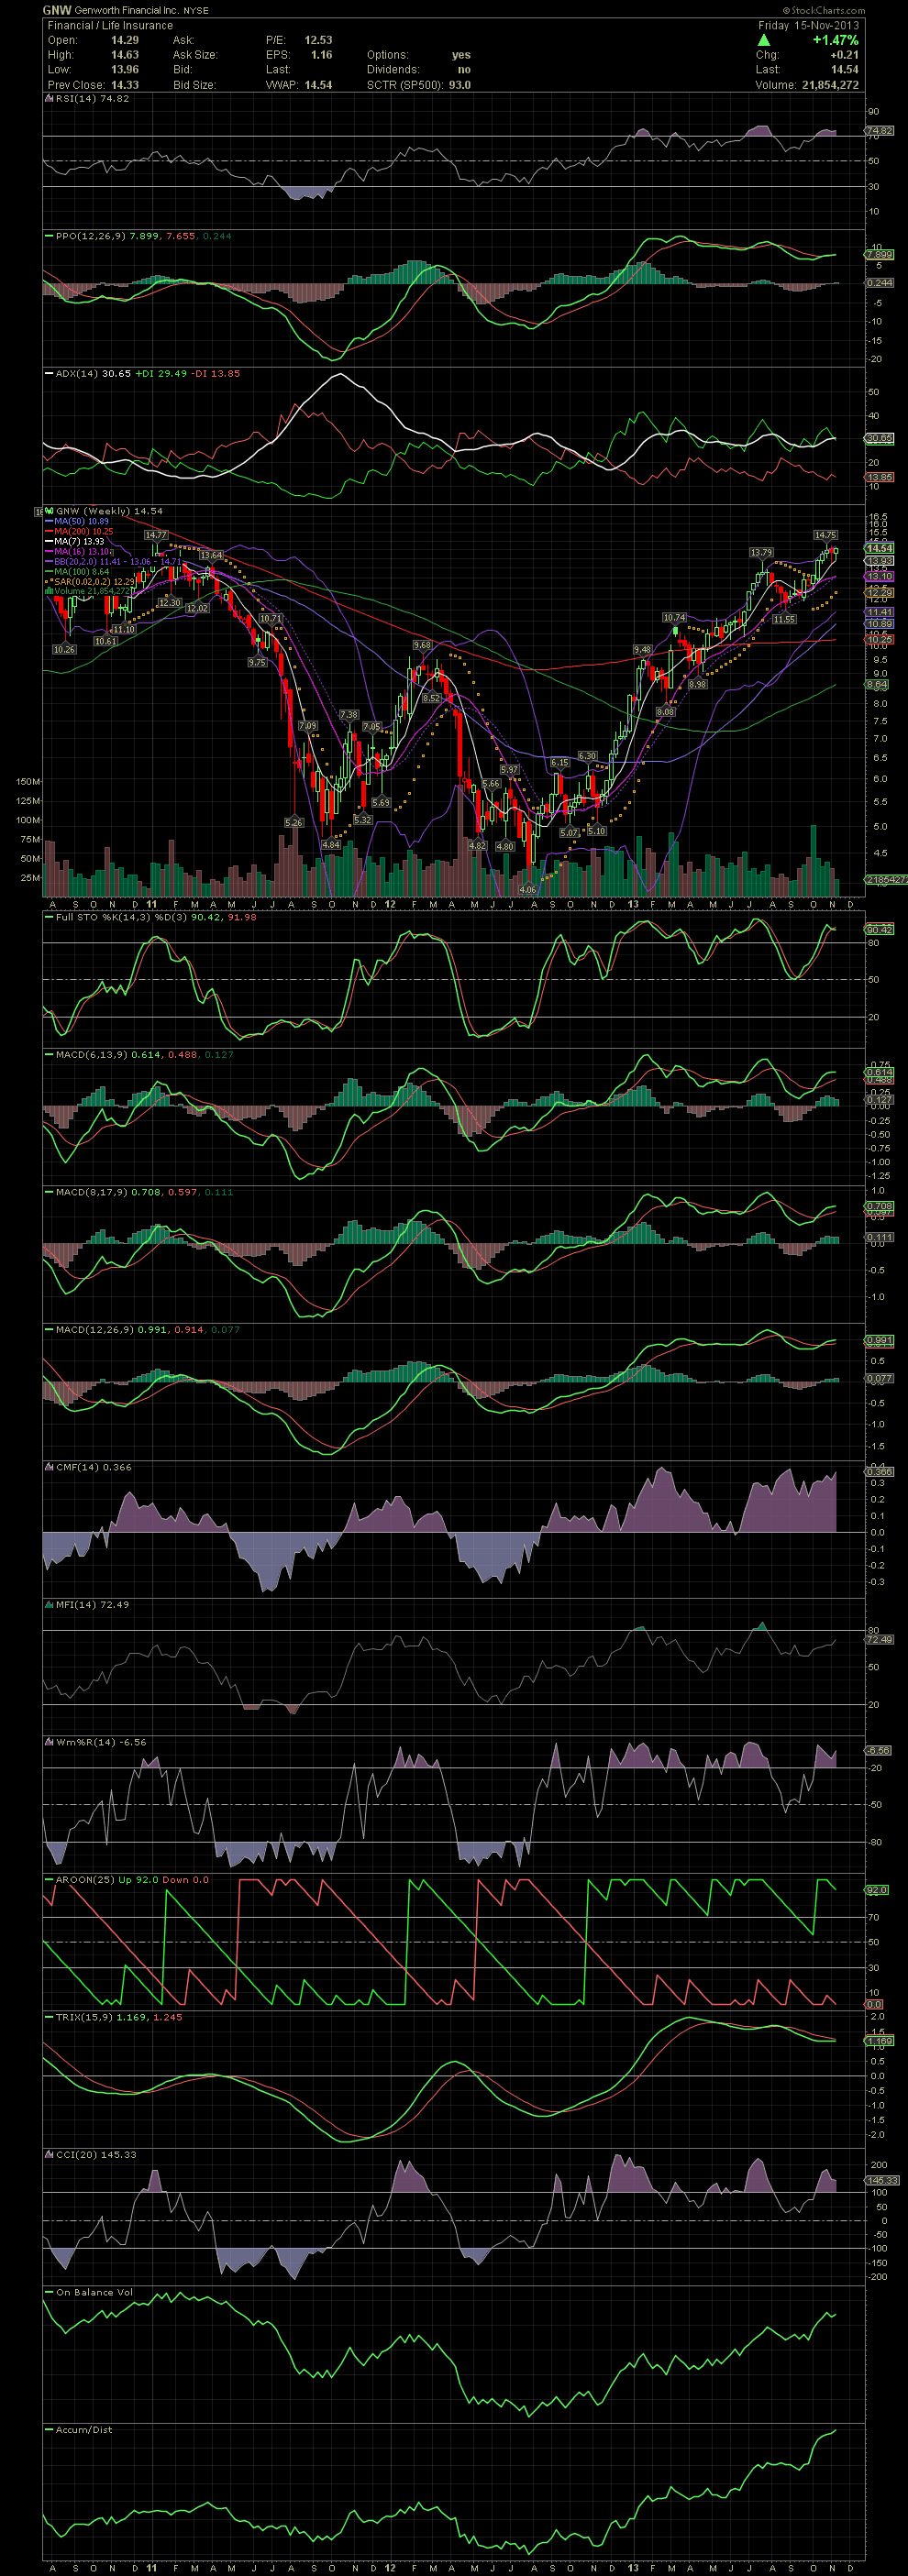
 (0)
(0) (0)
(0)