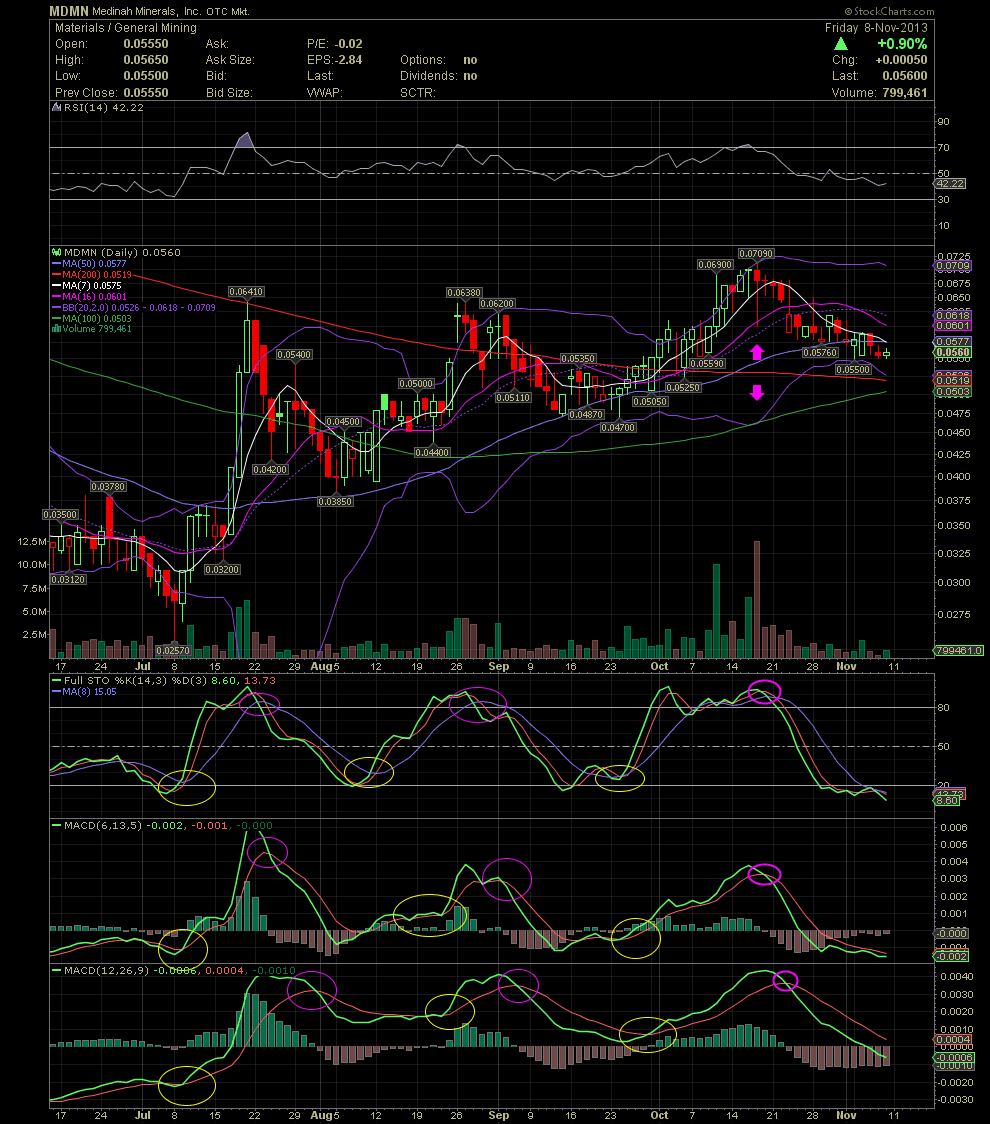
MDMN Daily Chart ~ Getting Closer for a Re-entry
Post# of 2561
Link back to Oct 28 for the last chart update on MDMN. The huge red volume day we talked about, which occurred on Oct 17, was the day for an exit. Just 1 to 3 days later, the FullSto and MACDs confirmed what a few of us believed would occur, that being a short term top due to the distribution of shares on that day. We are still waiting for the chart to reset itself in order to enter once again. The last week saw the stock price hold .055/.056 for five consecutive days now. The FullSto is in oversold territory, the faster MACD is leveling out, but the 12 day MACD still has some work to do. The MA7, 10, 16, and 20 are all in decline still. The MA100 and 200 are sitting at .0503 and .0519. Should the .055 short term bottom not hold, then these two moving averages should offer good support. A break under them, and the .047/.048 level would be next. A closer look at the 100 and 200 shows that a platinum cross (100 crossing over the 200) is about 1.5 weeks away. I don't place much importance on those two MAs as they are very long term and slow. The 100 and 200 are much better styled for the big boards than pennies, imo. On the positive side, the selling volume is tapering off. Obviously, the long awaited news would trump all technicals. Should that happen in our lifetime, then it would always be a good idea to hold a few shares while swing trading the rest. Oh how I wished I had done that earlier with my many years of holding MDMN.

 (0)
(0) (0)
(0)