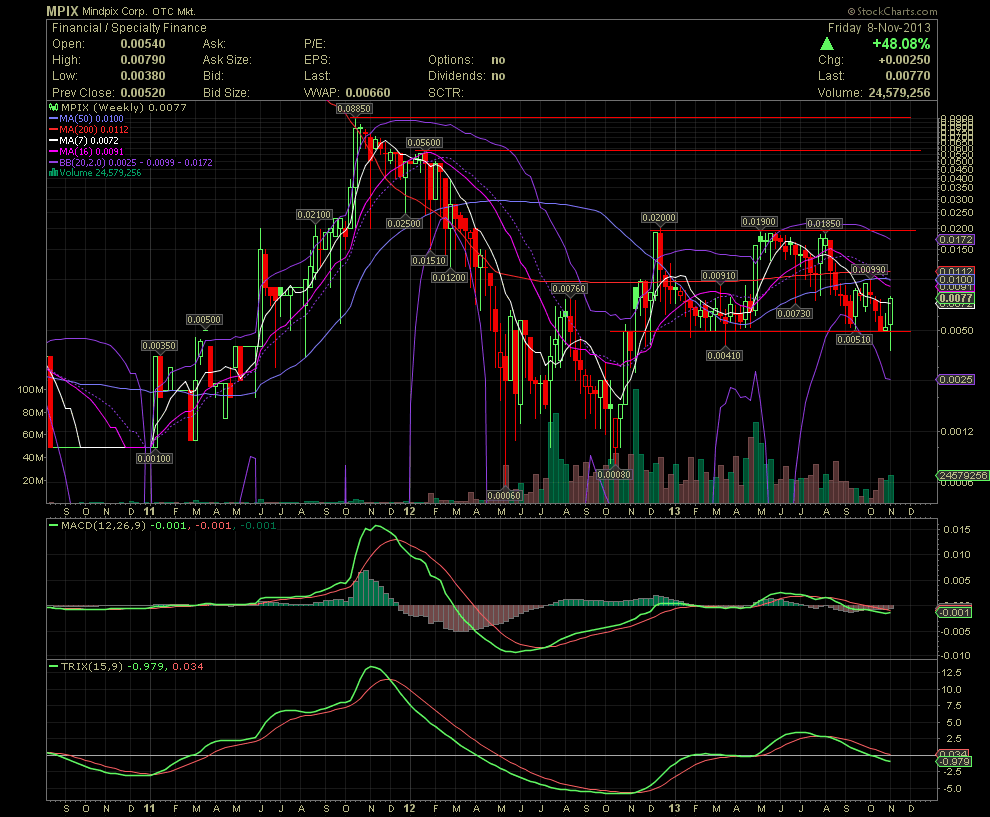
MPIX Weekly Chart ~ What a Story a Picture Tells
Post# of 5570

Keeping in mind the timelines of MPIX's history which I've shared opinions of, here's the weekly chart which says it all. The ex management dilution machine began long before I came across MPIX. I'm told MPIX moved on air back then, obviously with an OS at the time of approx 55 mil. Then the selling began. Check the volume bars shortly after the stock hit .0885. The stock dropped to as low as .0006 when the OS hit approx 360 mil. The stock still made its way from those lows to .02. Then in Dec 2012, another huge round of an OS increase collapsed the stock price to the .004/.005s. The OS was nearly 1.5 billion with absolutely zero to show for their shareholders, except massive dilution. As I mentioned previously, in late April, shareholders began to see some positive results with the acceptance of Victor Siegel and Saul Federman to management. Six to seven months of admin and financial repairs and building a strong foundation brings us up to date. Up 48% for the week and a solid PR to end the week. As Rod would say and sing, "Every Picture Tells a Story", don't it?

 (0)
(0) (0)
(0)