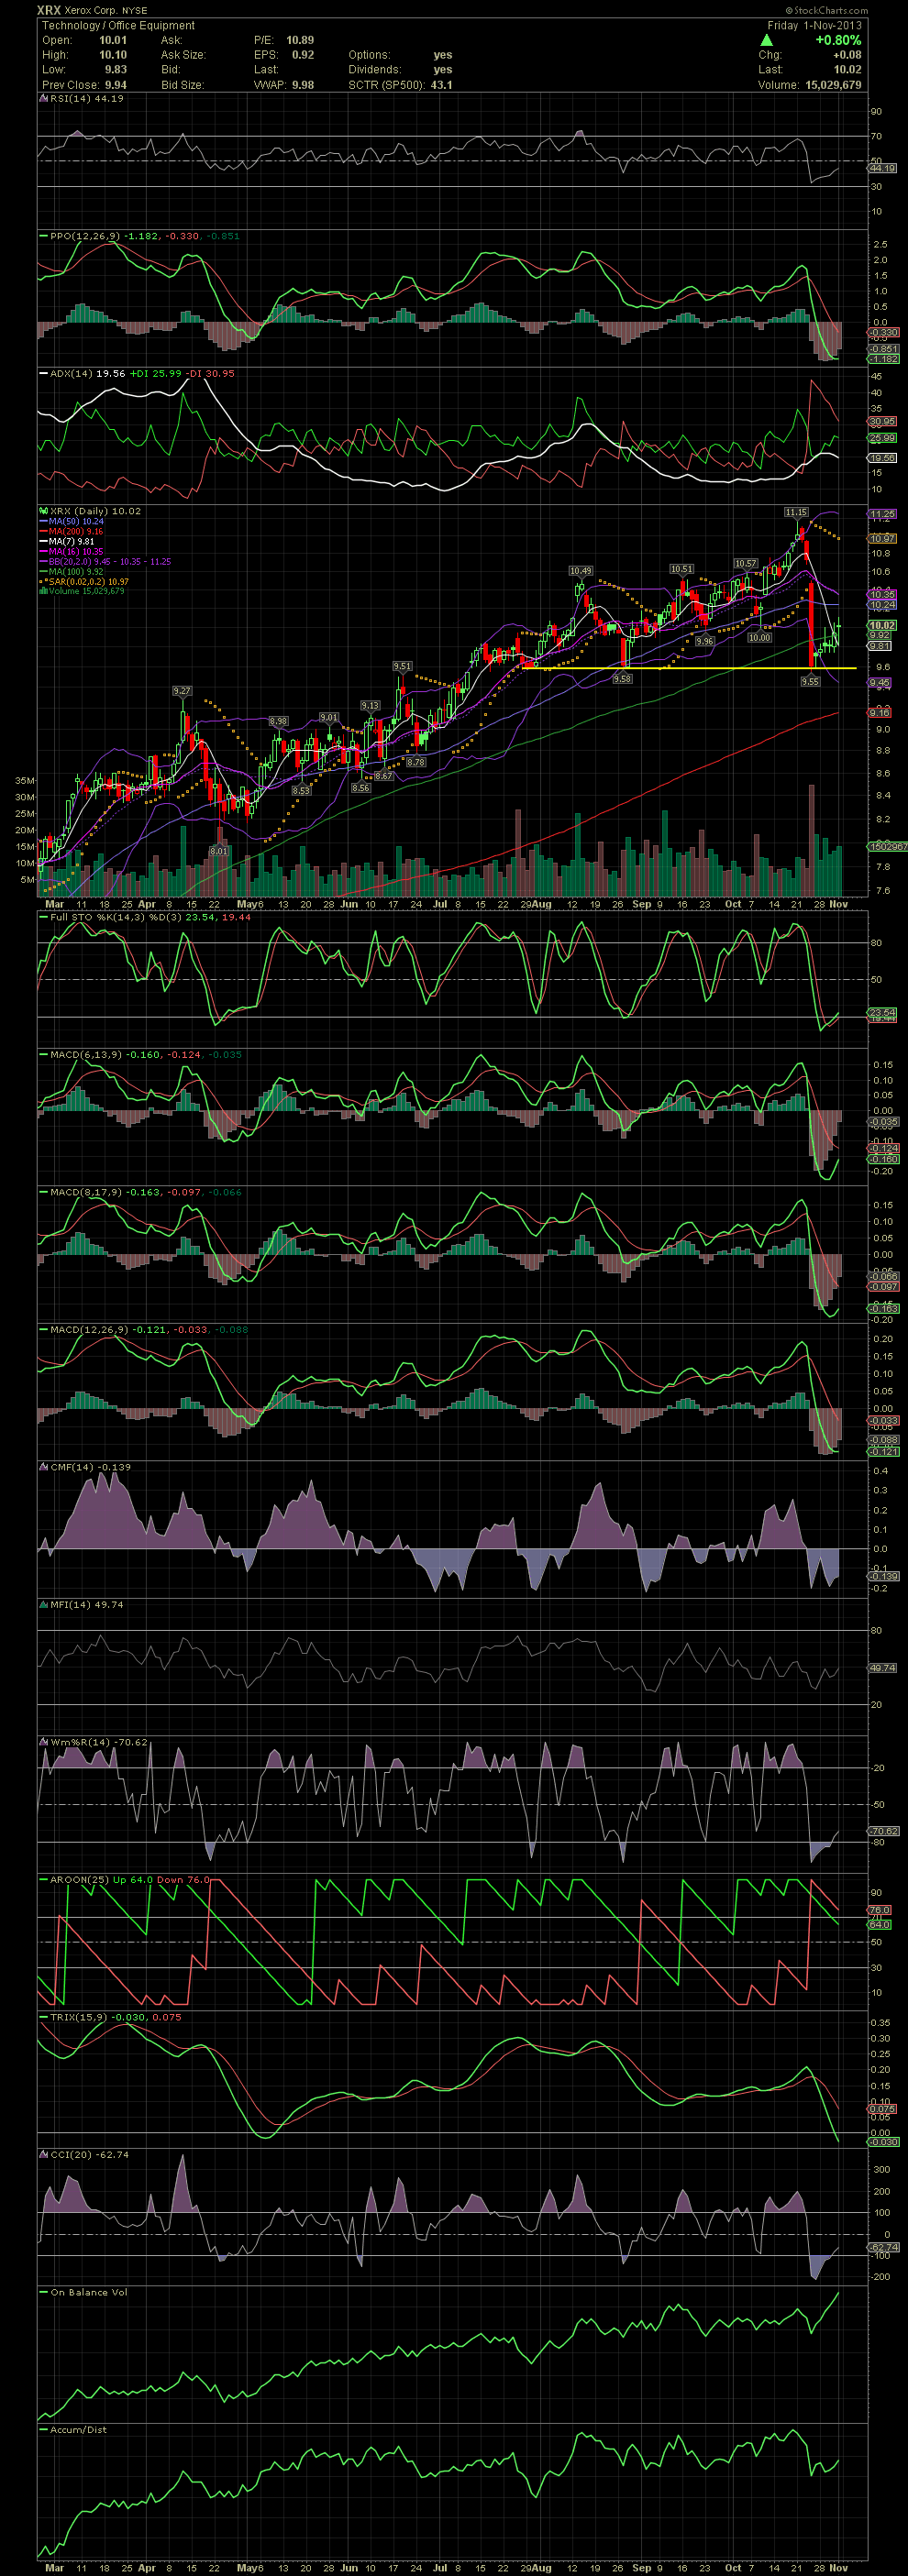
XRX Daily Chart ~ Long Term Uptrend Still Intact
Post# of 2561

Although most indicators haven't confirmed a buy signal yet, I entered XRX after the overreaction to XRX's financial report of the previous week. Every indictor was oversold enough, that I decided to 'cheat' and take advantage of the drop as XRX is a quality company. Not like attempting to catch a penny stock falling knife which can/will slices one to pieces. XRX was almost too easy to call as the stock fell to previous support levels. Check out the horizontal support line (yellow) and where the stock reversed on the second day of holding that line. Now we'll see how well the stock fights its way back up. XRX recaptured the MA100 this week. Just ahead are the MA16, 20, and 50s. There's a gap near the 10.50-10.70 level which will more than likely be filled shortly. From 9.55, that move would amount to more than 10% in a relatively short time frame. Not bad for a big board stock when compared to a CD or 10 year Treasury.

 (0)
(0) (0)
(0)