ARIA Daily Chart ~ Pay Attention to the Indicators
Post# of 2561
Posted On: 10/21/2013 12:55:38 AM

ARIA Daily Chart ~ Pay Attention to the Indicators!
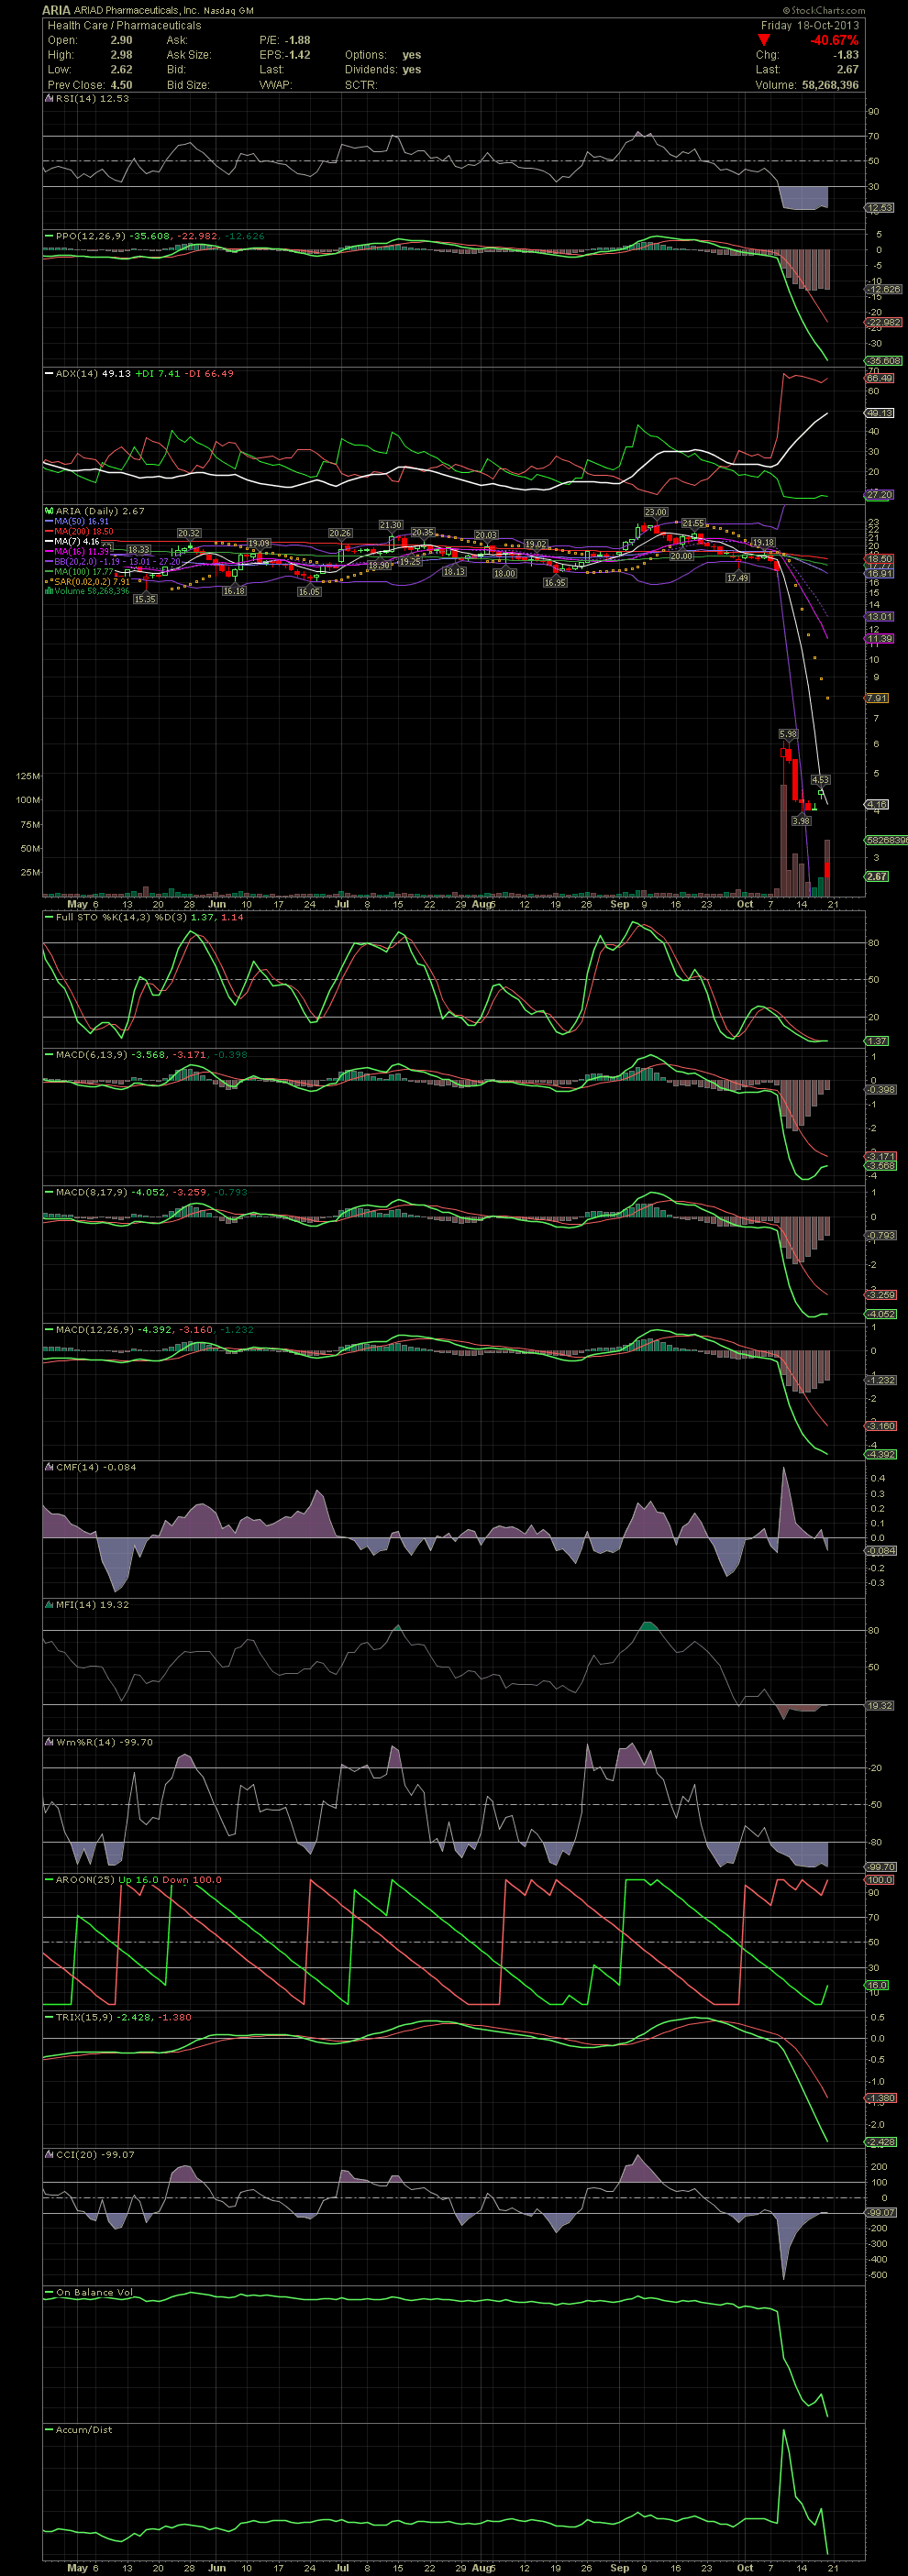
Although I wasn't invested in ARIA, I knew a few biotech/medical investors that were. The reason I'm posting this chart is to assist those that are still learning technical trading or aren't quite convinced that charting is a compliment to ones fundamental investing. I'm a full believer that tidbits of news always leak, both good news and bad news. Not on the ARIA chart the decline that began in early September when the stock was trading higher than $23.00. By mid September the FullSto and MACDs had already crossed to the downside. Although the stock attempted a comeback from the 17.00s, please note that although the FullSto did cross to the upside in late Sept, it was never confirmed by any of the MACD settings that I use. There was no reason to re-enter ARIA if you followed the indicators. Then the disaster occurred for those that were long on bad news from the FDA regarding one of the drugs the company was working on.
On never knows how far a stock might fall when a sell signal is given on the charts. But those that might have sold some or all when the indicators crossed to the downside were spared a wipeout of approx 65% overnight a good 2-3 weeks before the actual event. Charts are a fantastic tool when swing trading or investing in the big boards. They are much more difficult to use in the volatile penny arena, but they do work well. Stay disciplined and you'll do well. GLTA
 (0)
(0) (0)
(0)