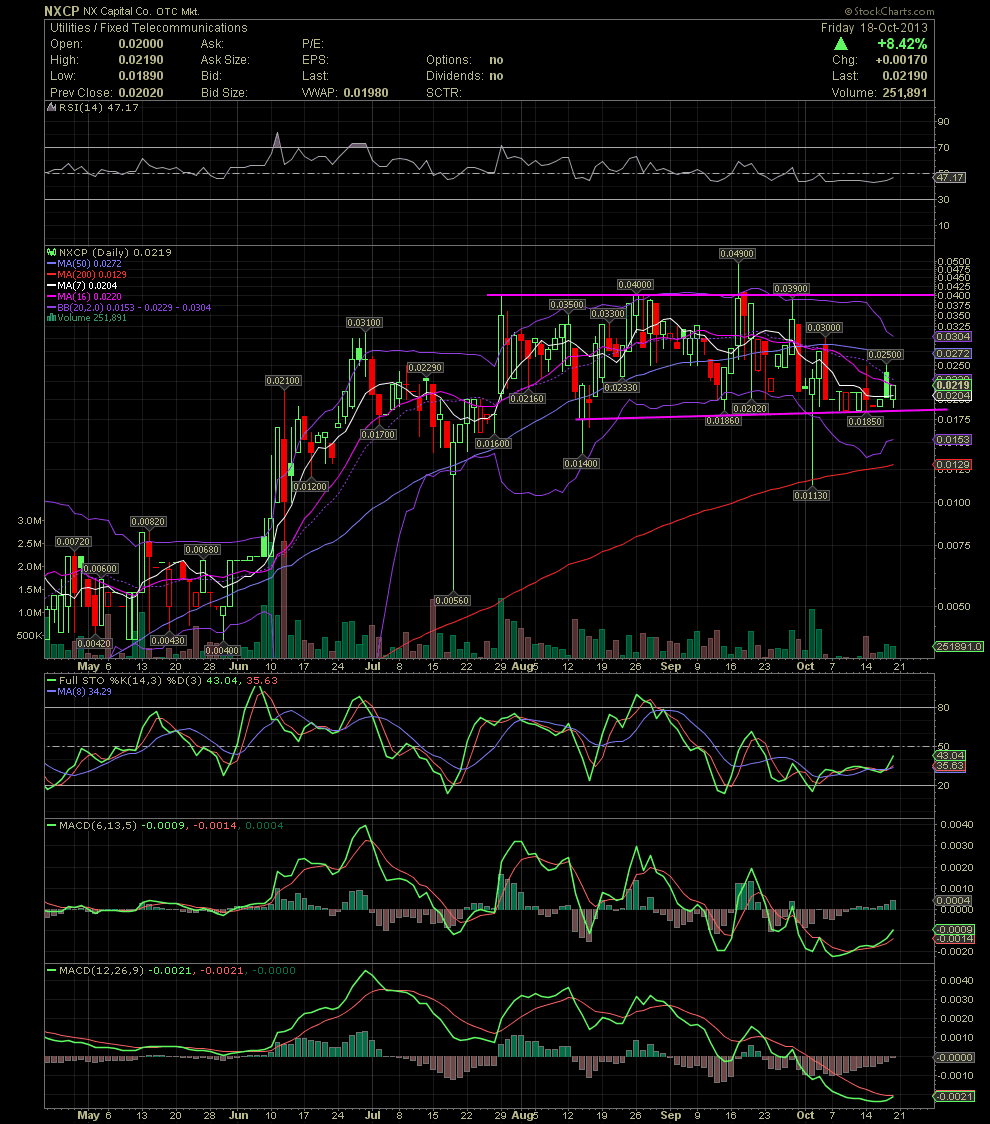
NXCP Daily Chart ~ Trending in a Channel as We Wai
Post# of 2561

After some initial entries in the double zeroes, many of us continued to add in the .01s, .02s, and a few .03s. The last two weeks allowed a few of us to add even more NXCP in the high .01s and low .02s. Rumors have news of NXCP becoming current with their filings any day now. That event could proceed or come just after the long awaited closing of the uranium acquisition. If so, then NXCP could see dimes in the near future. We shall see.
As for the technicals, there hasn't been much to talk about. While NXCP has been channeling between the .02ish to .04s over the last few months, the FullSto and MACDs have gradually declined from overbought levels in June to oversold levels in the first three weeks of October. These indicators have now started to crossover to the positive. NXCP is also a thinly traded stock with approx 43 mil shares in the float. News of the large uranium acquisition being consummated would probably send this stock easily to .11. Check the Weekly Charts I've posted in the past for an understanding of the resistance points should the stock take out the recent high of .049. Liking this stock a LOT! GLTA

 (0)
(0) (0)
(0)