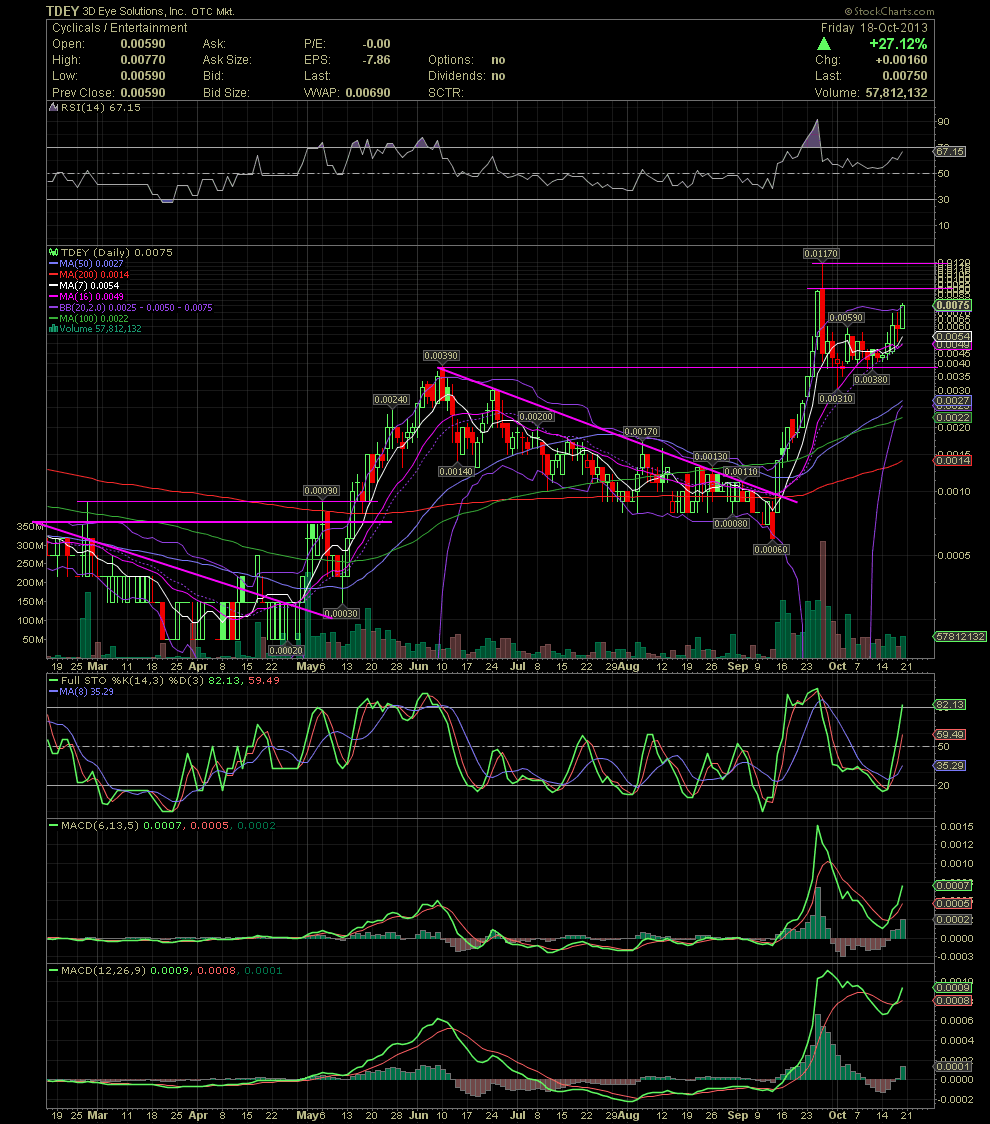
TDEY Daily Chart ~ Moving Up Nicely After a Two We
Post# of 2561

I was hoping for the .0039 June high to hold as support during the pullback over the least two weeks. That level held as support although we did see a couple of days trade below .0039 intraday. The FullSto and MACDs began to show some movement towards the upside on Wed thru Friday, while the stock moved from .004 to .0077 and closing at .0075 on Friday. Selling a few when the stock ran decisively outside the upper bollie was the right move. Congrats to many of you that took a few off the table and re-entered this last week. The next levels of resistance are sitting at .009 and .0117. Should those horizontal points be taken out with strong volume, I would expect to see a test of the .03-.05 levels in the next few weeks. GLTA

 (0)
(0) (0)
(0)