Posted On: 09/26/2013 9:44:53 PM
Post# of 2561

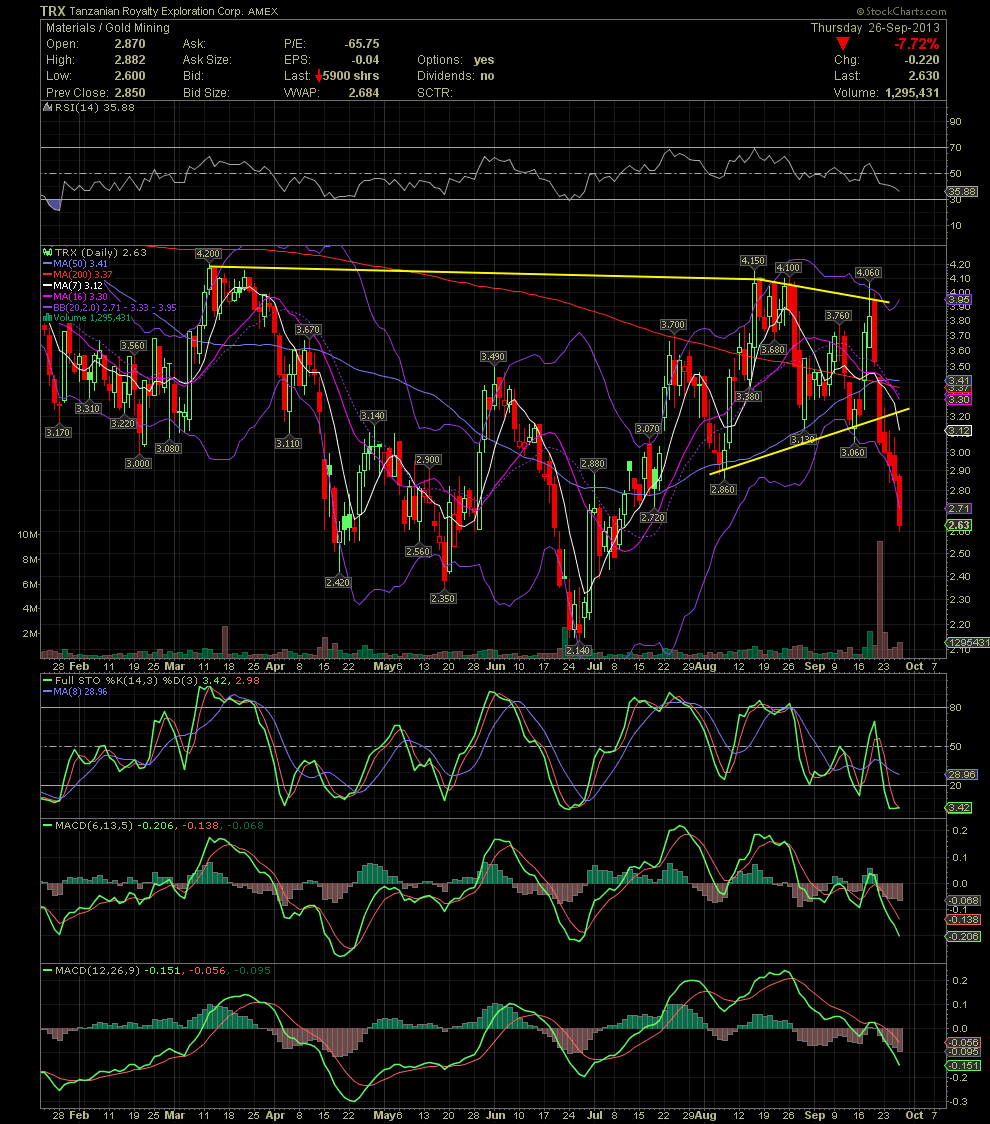
TRX Daily Chart ~ Follow the Indicators and Trendlines
I posted a TRX chart for a friend two days ago when the stock was $3.00. Since then, TRX fell almost 15% more. After failing to breakout of the declining tops line last week, the stock has been in a free fall. Where it will finally finish is yet to be seen. For those that are following TRX, you might look at previous bottom reversals occurred to better assist your next re-entry. Those are at 2.42, 2.35 and 2.14. The FullSto is very oversold and beginning to flatten out, whereas the MACDs are also in oversold territory but nowhere near a reversal yet. As I mentioned to my friend, TRX is one volatile stock but can be successfully traded if one can trade without emotion and use the technicals to assist your entries and exits.
I posted a TRX chart for a friend two days ago when the stock was $3.00. Since then, TRX fell almost 15% more. After failing to breakout of the declining tops line last week, the stock has been in a free fall. Where it will finally finish is yet to be seen. For those that are following TRX, you might look at previous bottom reversals occurred to better assist your next re-entry. Those are at 2.42, 2.35 and 2.14. The FullSto is very oversold and beginning to flatten out, whereas the MACDs are also in oversold territory but nowhere near a reversal yet. As I mentioned to my friend, TRX is one volatile stock but can be successfully traded if one can trade without emotion and use the technicals to assist your entries and exits.