Posted On: 09/24/2013 12:04:35 AM
Post# of 5570

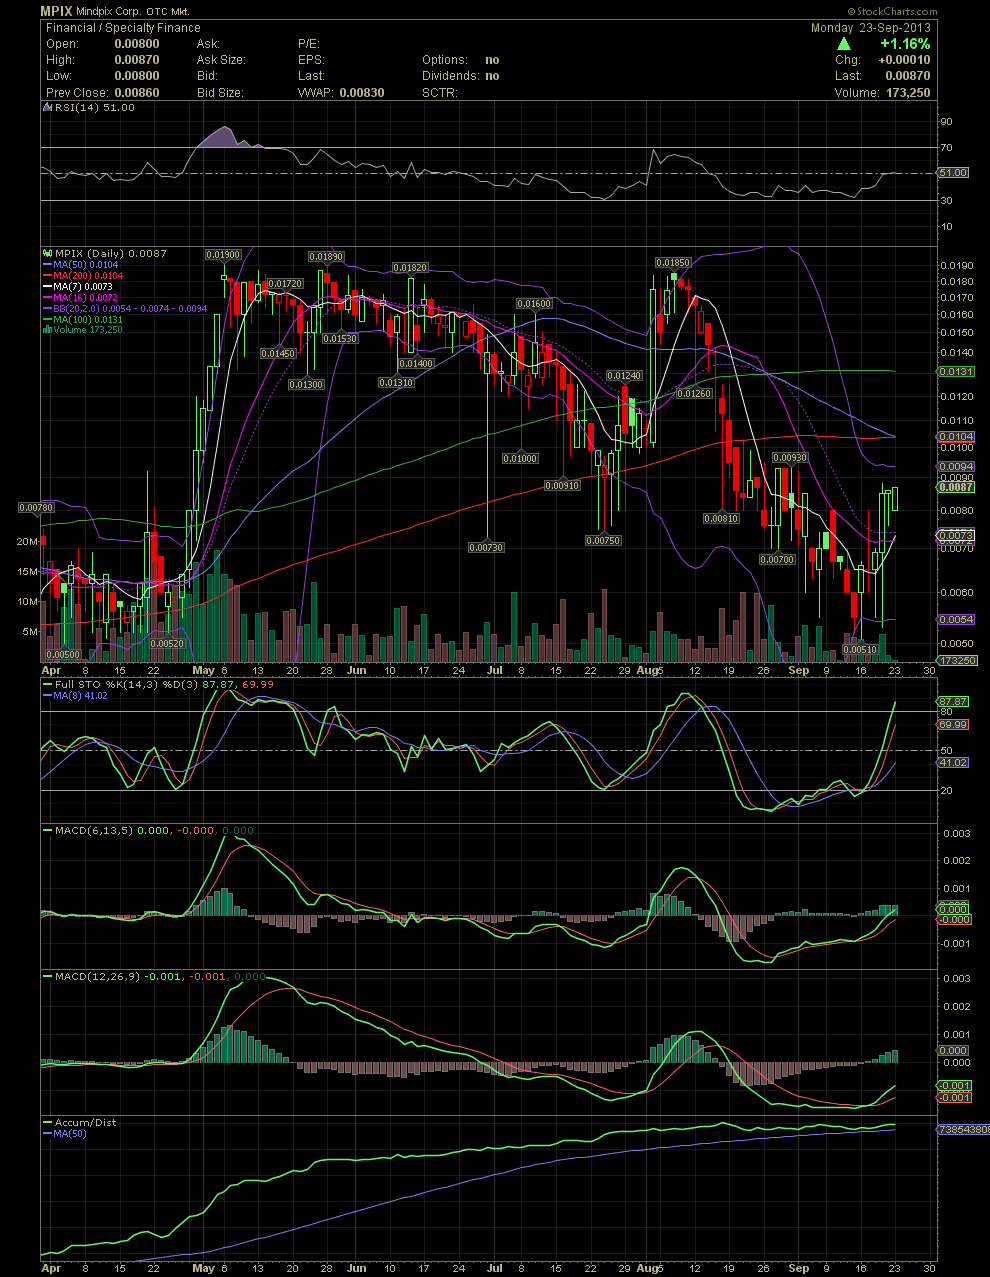
MPIX Daily Chart ~ Six Month Timeframe
Here's a closer look at the various moving averages. As you can see, the MA7 has moved over the MA16 for the first time since mid August. It is also going to crossover the Middle Bollie, aka the MA20 as early as tomorrow. The MA50, 100, and 200 are hanging above from .0104 to .0131. It would be a very strong indication of a strong move ahead should the stock regain its position above those moving averages. For those inclined to understand the importance of the different crosses to the upside and downside of the MA7/16, just follow the moves on this six month chart. The MA7 is white and the MA16 is pink. Compare the moves of the stock to the crossovers whether up or down. Now scroll down to the FullSto and MACDs. Take note of the crossovers of green over red and red over green. Yeah, I know, it's all mumbo jumbo, but it works for me. Have a good evening and GLTA.
Here's a closer look at the various moving averages. As you can see, the MA7 has moved over the MA16 for the first time since mid August. It is also going to crossover the Middle Bollie, aka the MA20 as early as tomorrow. The MA50, 100, and 200 are hanging above from .0104 to .0131. It would be a very strong indication of a strong move ahead should the stock regain its position above those moving averages. For those inclined to understand the importance of the different crosses to the upside and downside of the MA7/16, just follow the moves on this six month chart. The MA7 is white and the MA16 is pink. Compare the moves of the stock to the crossovers whether up or down. Now scroll down to the FullSto and MACDs. Take note of the crossovers of green over red and red over green. Yeah, I know, it's all mumbo jumbo, but it works for me. Have a good evening and GLTA.