Posted On: 09/02/2013 9:13:00 PM
Post# of 2561

MINE Daily Chart ~ A Thing of Beauty
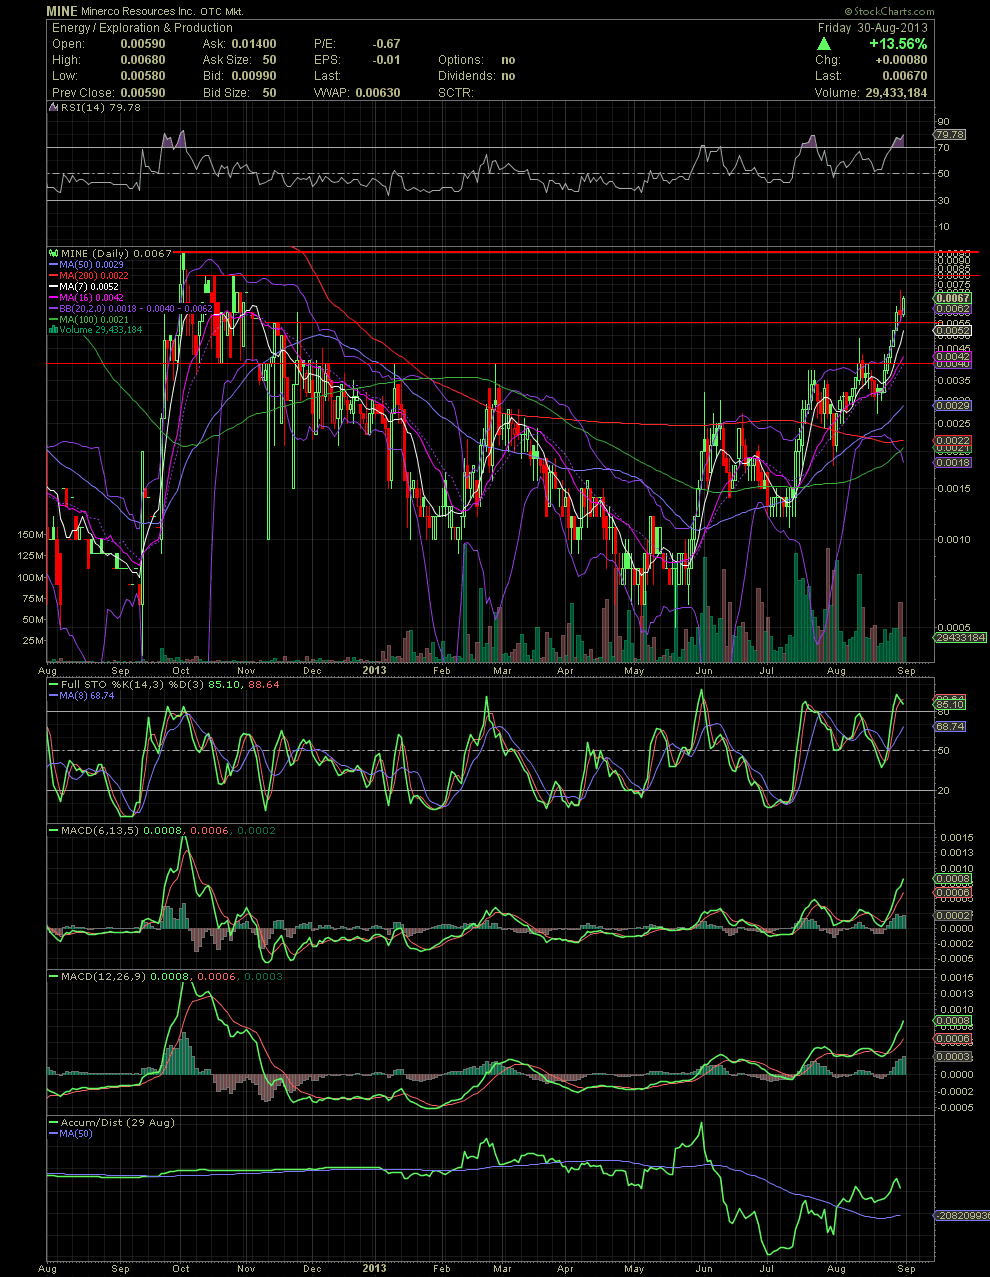
Here is a 14 month chart allowing us to see the various horizontal resistance points that I've mentioned previously. The next one is at .008, and the much more important resistance at .0095. The RSI and FullSto are already fairly overbought, but the MACDs have room to move much higher. One never knows when a stock might top out and correct. MINE could selloff and put in a higher low as it has over the last few months. Or it could run much higher on major material news. The longer term potential of MINE rests 100% on the execution and success of management in regards to Level 5. For those looking for possible future resistance points, the MINE Weekly Chart is up next. GLTA

Here is a 14 month chart allowing us to see the various horizontal resistance points that I've mentioned previously. The next one is at .008, and the much more important resistance at .0095. The RSI and FullSto are already fairly overbought, but the MACDs have room to move much higher. One never knows when a stock might top out and correct. MINE could selloff and put in a higher low as it has over the last few months. Or it could run much higher on major material news. The longer term potential of MINE rests 100% on the execution and success of management in regards to Level 5. For those looking for possible future resistance points, the MINE Weekly Chart is up next. GLTA

