Renko, Range bars and Heiken Ashi Candles Info
> Renko Charts Definition
http://www.investopedia.com/terms/r/renkochar...z2434PSf6i
> Renko Charting - Trading Without Noise
http://www.investopedia.com/articles/trading/...z2436w5Hd3 :
Definition of 'Renko Chart '
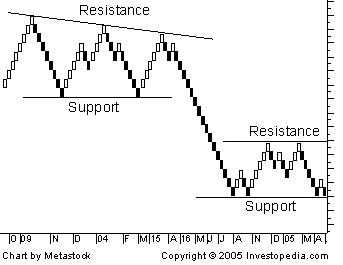
A type of chart, developed by the Japanese, that is only concerned with price movement; time and volume are not included . It is thought to be named for the Japanese word for bricks, "renga". A renko chart is constructed by placing a brick in the next column once the price surpasses the top or bottom of the previous brick by a predefined amount. White bricks are used when the direction of the trend is up, while black bricks are used when the trend is down. This type of chart is very effective for traders to identify key support/resistance levels. Transaction signals are generated when the direction of the trend changes and the bricks alternate colors.
Renko charts are price charts with rising and falling diagonal lines of boxes that are either filled or hollow.Renko charts are "time independent" charts that do not have constantly spaced time axes.

> Heikin-Ashi Definition
http://www.investopedia.com/terms/h/heikinash...z2435mgBeD
> Heikin-Ashi A Better Candlestick
http://www.investopedia.com/articles/technica...z2435yVUuO
Definition of 'Heikin-Ashi Candles'
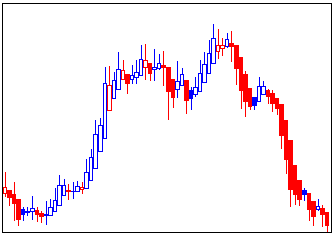
Heikin-Ashi Candlesticks are an offshoot from Japanese candlesticks. Heikin-Ashi Candlesticks use the open-close
data from the prior period and the open-high-low-close data from the current period to create a combo candlestick.
The resulting candlestick filters out some noise in an effort to better capture the trend. In Japanese,
Heikin means "average" and "ashi" means "pace". Taken together, Heikin-Ashi represents the average-pace of prices.
Heikin-Ashi Candlesticks are not used like normal candlesticks. Dozens of bullish or bearish reversal patterns
consisting of 1-3 candlesticks are not to be found. Instead, these candlesticks can be used to identify trending
periods, potential reversal points and classic technical analysis patterns

> Range Bar Charts : A Different View Of The Markets
http://www.investopedia.com/articles/trading/...z2434xOG6M
Range Bar Candles Definition
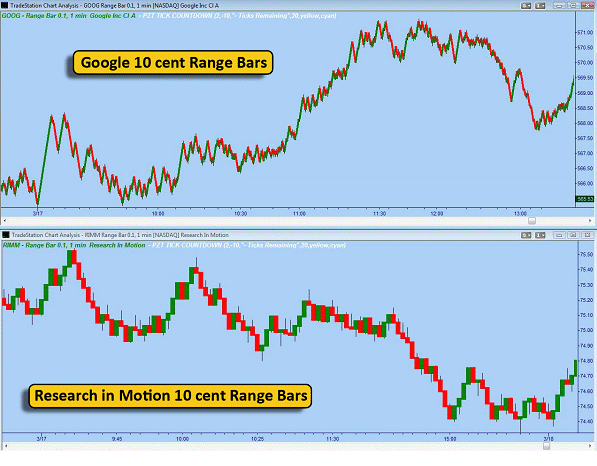
Range bars take only price into consideration; therefore, each bar represents a specified movement of price. Traders and investors may be familiar with viewing bar charts based on time; for instance, a 30-minute chart where one bar shows the price activity for each 30-minute time period. Time-based charts, such as the 30-minute chart in this example, will always print the same number of bars during each trading session, regardless of volatility, volume or any other factor. Range Bars, on the other hand, can have any number of bars printing during a trading session: during times of higher volatility, more bars will print; conversely, during periods of lower volatility, fewer bars will print. The number of range bars created during a trading session will also depend on the instrument being charted and the specified price movement of the range bar.

======= Heres some Setups or Examples that i took screenshots using these 3 platforms =======
http://imgur.com/a/JYTlI
1- Quotetracker (Renko 25c - 50c & $ 1 box size)
2- TOS aka ThinkorSwim (RangeBars $ 1 & HeikenAshi 15 min)
3- MetaTrader4 (Renko on EUR/USD using 5 pips and 10 pips box size)
Main Source of info www.investopedia.com
#OM #Stock #Option
