Posted On: 08/26/2013 9:40:32 AM
Post# of 2561

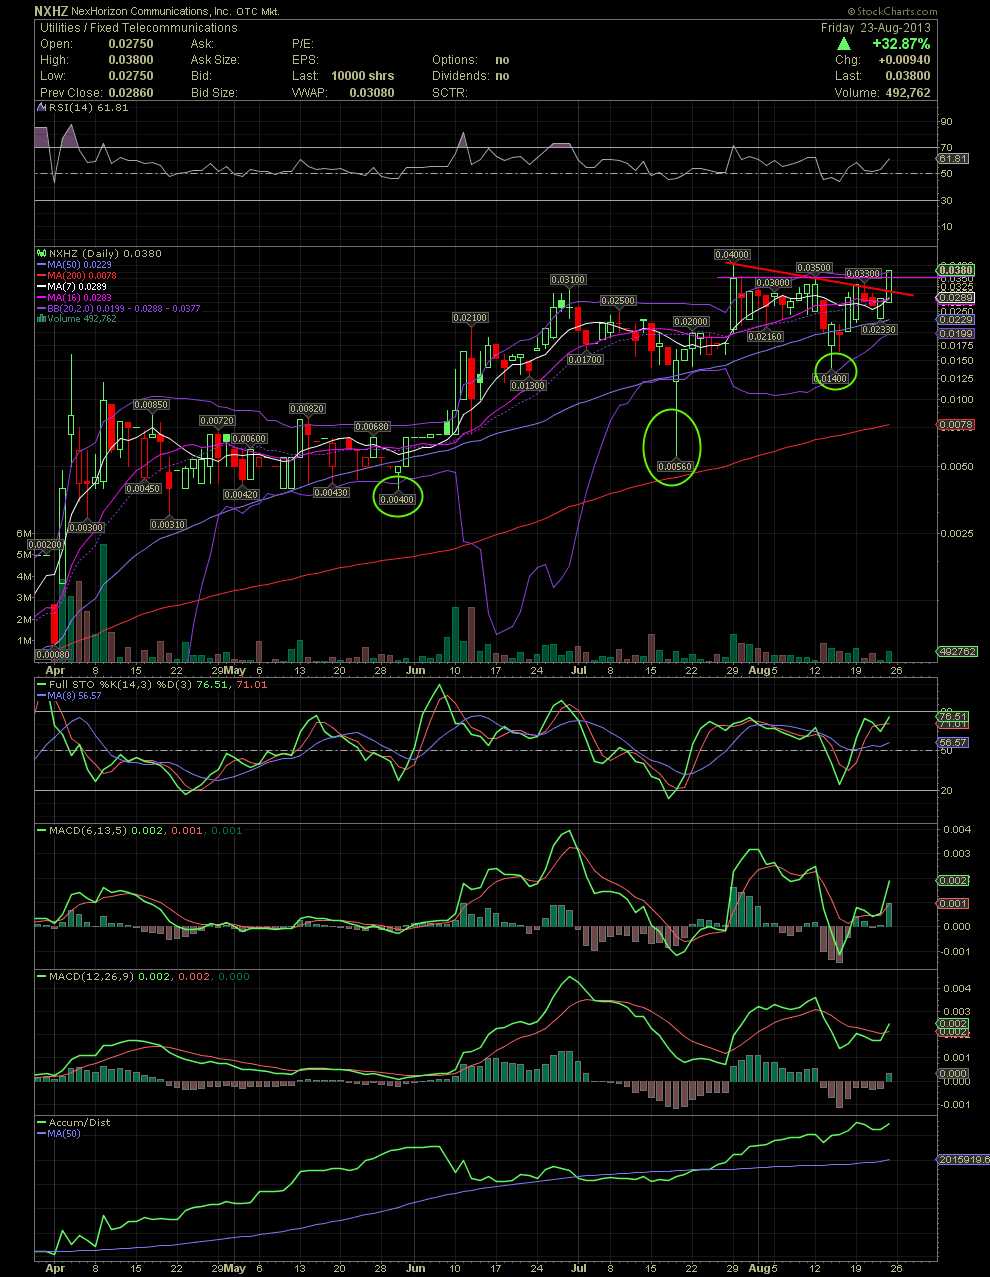
NXHZ Daily Chart ~ Closed at it's Highest Point Since the 3rd Quarter of 2009
Slow and steady with NXHZ has been the ticket for some time now. Buying the dips on this thinly traded issue with only 40.7 mil shares in the float has proven to be the right strategy. All the indicators are pointing to a further move up as shareholders and potential investors await news of the company's uranium acquisition. Should that occur, I've made a case for a potential move into the .10s and eventually into the .40/.50 levels. Link back to previous NXHZ Weekly Charts for an opinion of where I think we could see NXHZ go once any of the uranium news is released. GLTA
Slow and steady with NXHZ has been the ticket for some time now. Buying the dips on this thinly traded issue with only 40.7 mil shares in the float has proven to be the right strategy. All the indicators are pointing to a further move up as shareholders and potential investors await news of the company's uranium acquisition. Should that occur, I've made a case for a potential move into the .10s and eventually into the .40/.50 levels. Link back to previous NXHZ Weekly Charts for an opinion of where I think we could see NXHZ go once any of the uranium news is released. GLTA