Posted On: 08/18/2013 9:40:10 AM
Post# of 2561

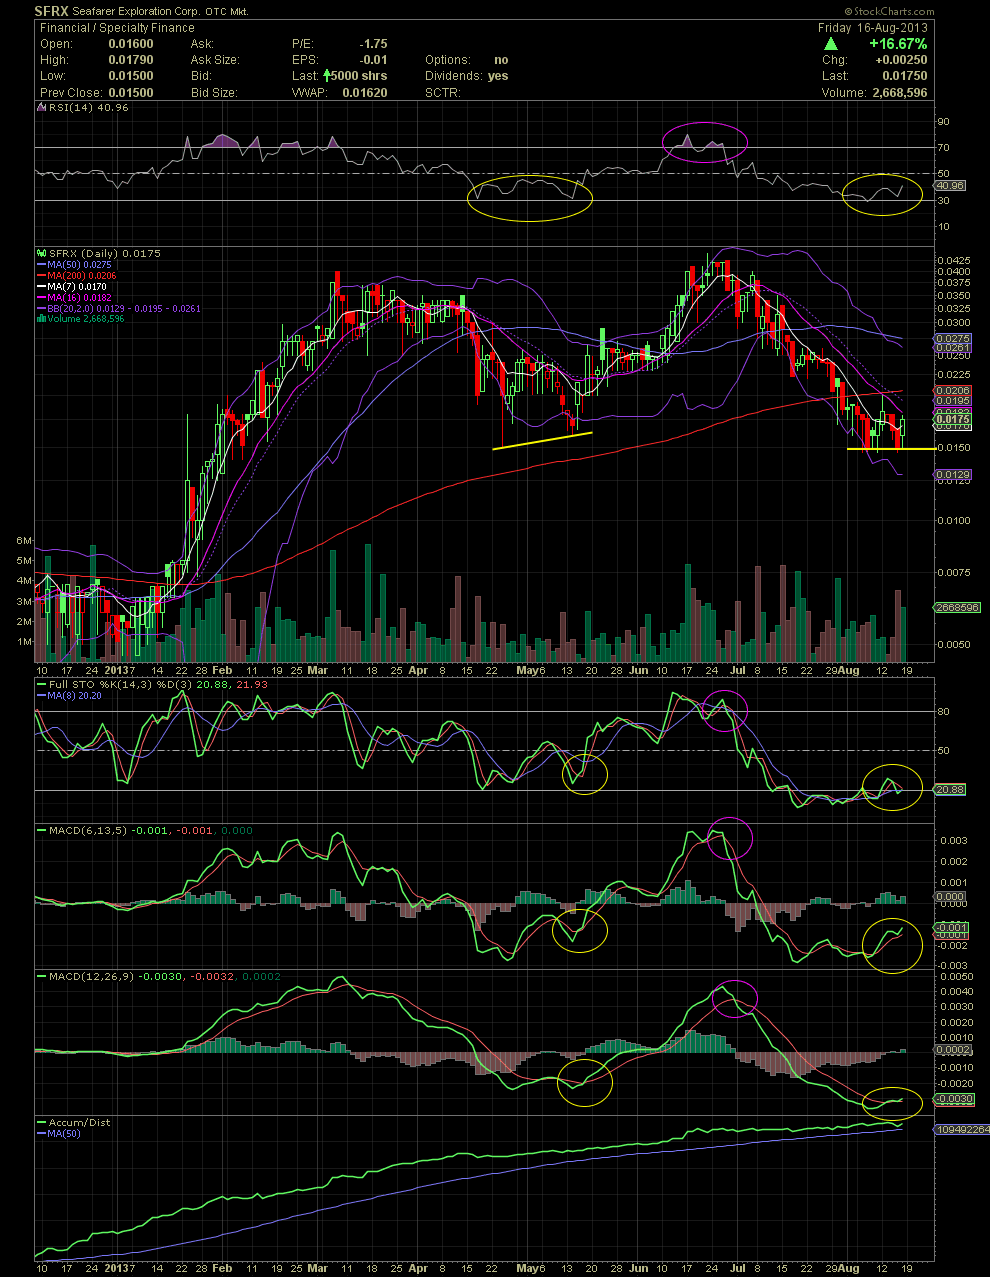
SFRX Daily Chart ~ The Recent Basing at the .015-.175 Level Should Be Looked At
The SFRX indicators are beginning to look interesting after a two month selloff. Note the current positions of the RSI, FullSto, and MACDs and compare them to their positions of April and May. The various moving averages are still in decline, but anymore basing in the .015-.0175 area would allow those MAs to begin leveling out. SFRX could be setting up for the next leg up. This will be trade number three for a few of us. GLTA
The SFRX indicators are beginning to look interesting after a two month selloff. Note the current positions of the RSI, FullSto, and MACDs and compare them to their positions of April and May. The various moving averages are still in decline, but anymore basing in the .015-.0175 area would allow those MAs to begin leveling out. SFRX could be setting up for the next leg up. This will be trade number three for a few of us. GLTA