Posted On: 08/11/2013 3:17:24 PM
Post# of 2561

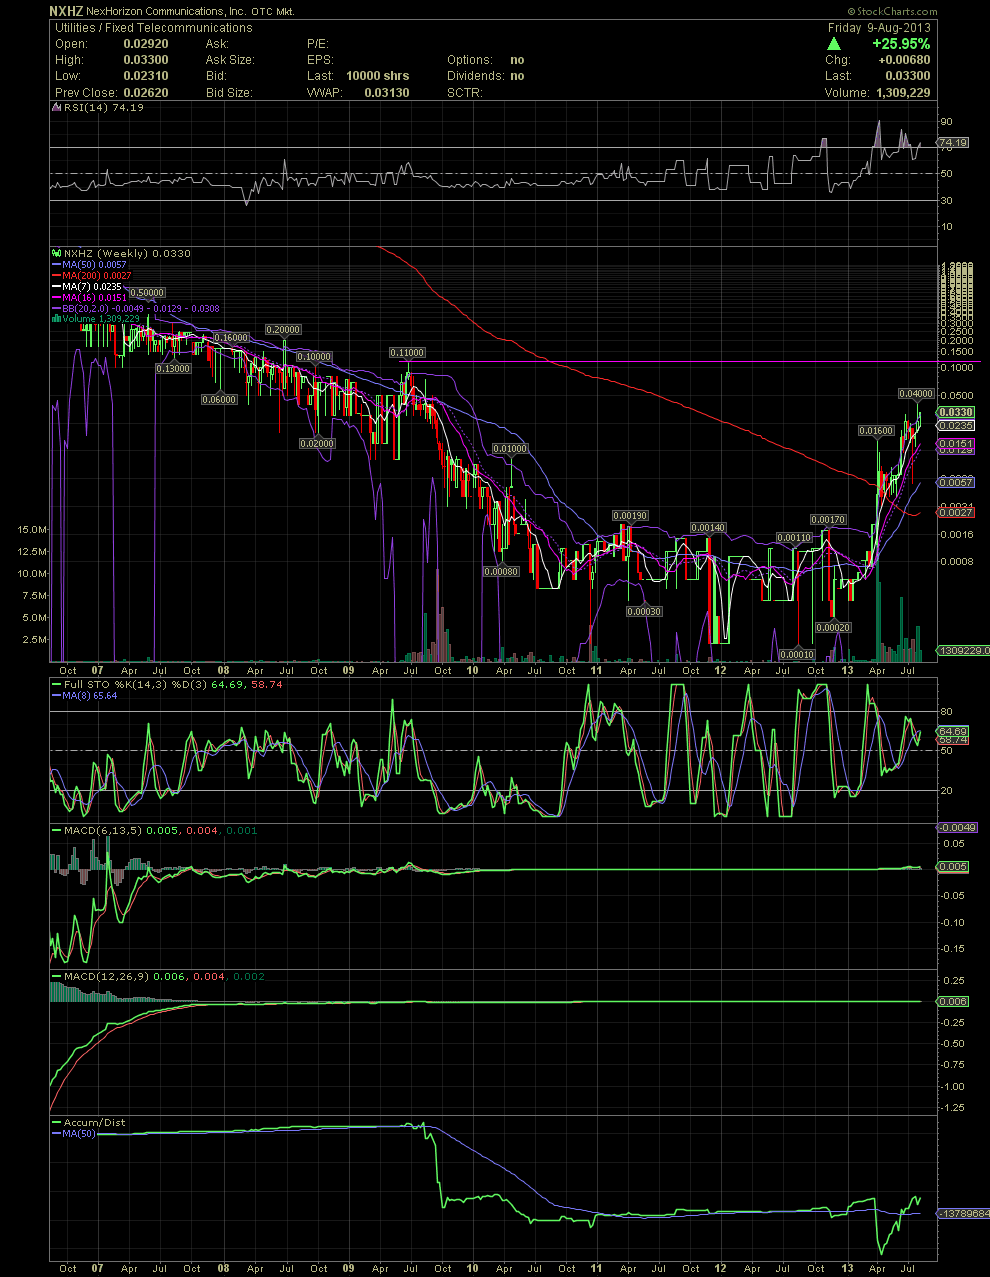
NXHZ Weekly Chart ~ A Compelling Story with a Super Long Term Potential
The NXHZ weekly chart shows strong accumulation since April (check the volume bars and the AD Line). I really don't see any real resistance until the stock get near .10. The horizontal tip is at .11 and then .20. My longer term targets based on some DD suggests that NXHZ could see a substantial move over the next few weeks and months. GLTA
The NXHZ weekly chart shows strong accumulation since April (check the volume bars and the AD Line). I really don't see any real resistance until the stock get near .10. The horizontal tip is at .11 and then .20. My longer term targets based on some DD suggests that NXHZ could see a substantial move over the next few weeks and months. GLTA