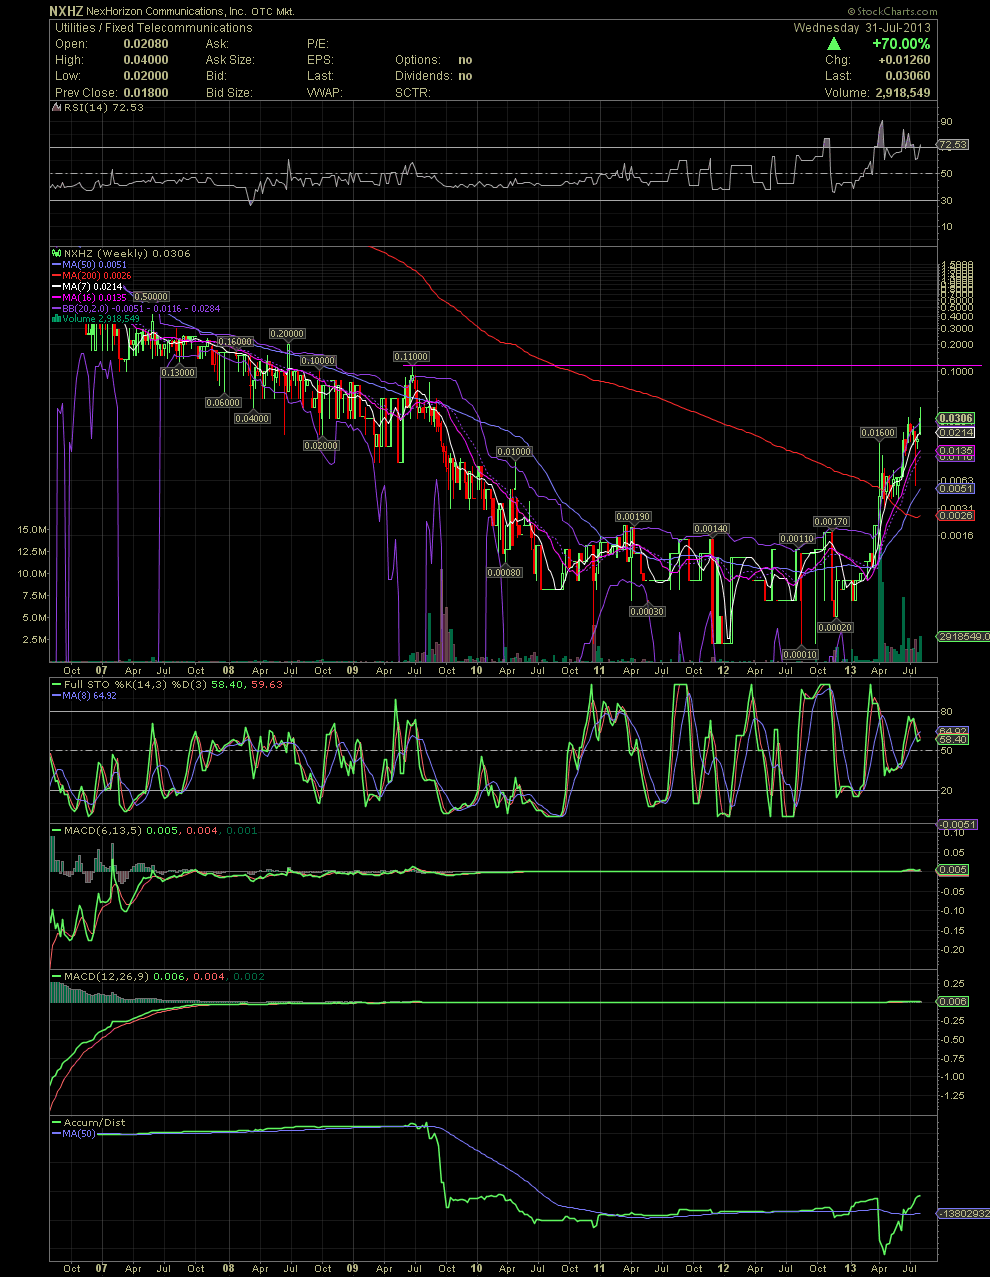
NXHZ Weekly Chart ~ The Big Picture for the Longer Term Potential
Link back to my previous post on NXHZ for some thoughts of a possible move to .11 and higher. A view of the NXHZ Weekly Chart shows a strong reversal underway once the company emerged from bankruptcy approx four months ago. The technicals show a move over the MA200 in April for the first time ever in the stock's history. My initial target of .11 can be seen as horizontal resistance (pink). Since many traders use round numbers, I would expect some profit taking at .10. Should we see a move to this level, then .20 could be viewed as a reasonable target next. Many of you are invested from the low .01s and up. As I've said to those who have PMd me, I would continue to use any selloffs/dips as opportunities to add to your positions. All my opinion, as always, but this weekly chart tells a story. GLTA

