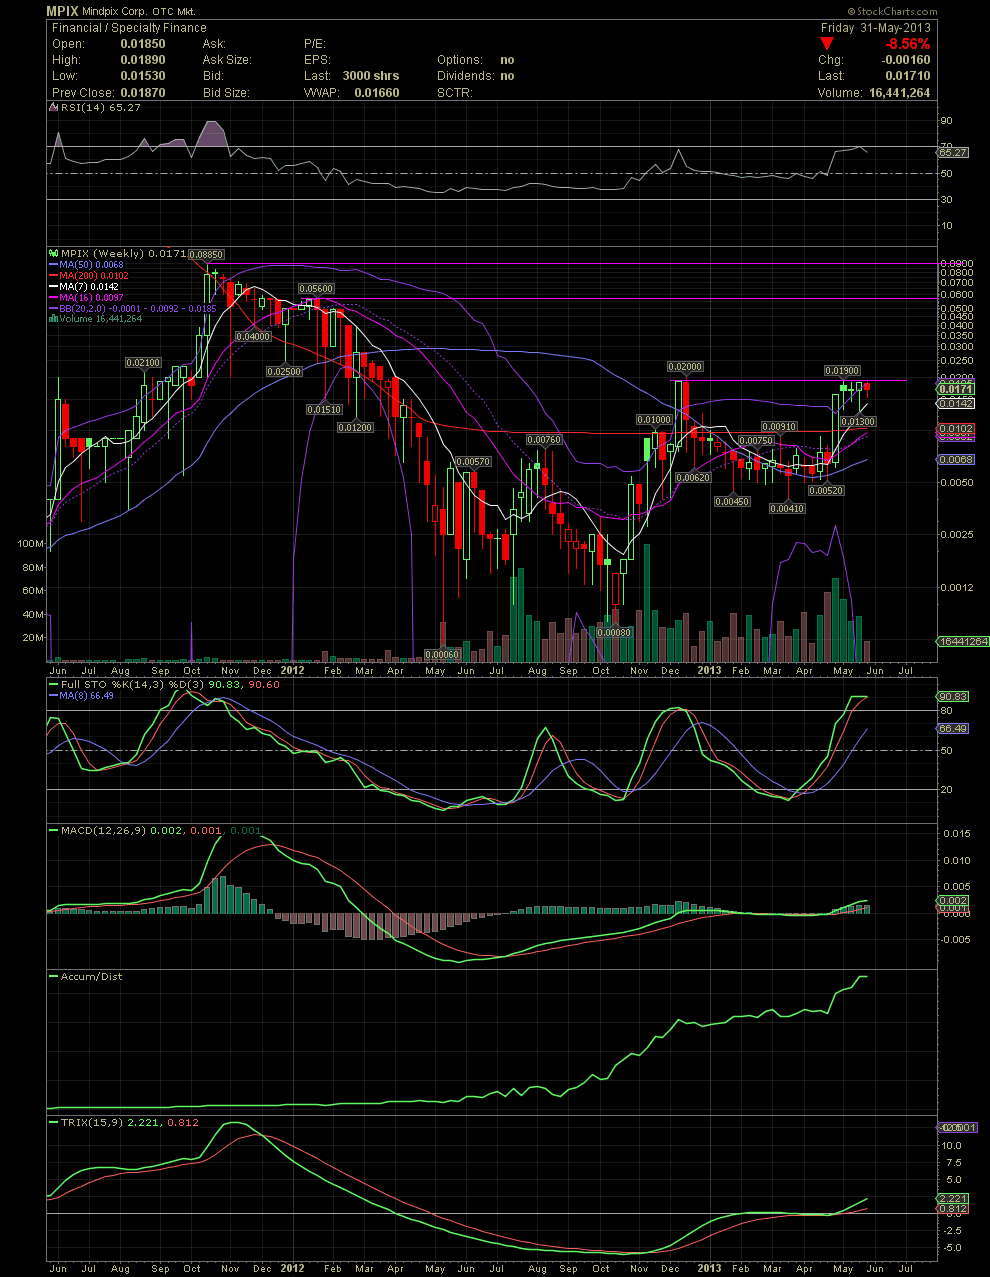
MPIX Weekly Chart...... For those just focusing on the shorter term daily chart for investment decisions, you are possibly missing the Big Picture!
Here you go! A huge, but failed (check previous post) 'W' formation, and beautiful Cup and Handle Formation, a strong AD Line, and a MACD and TRIX that are just beginning to make a move up. My excitement of a breakout above that .02 should be even more obvious on the Weekly Chart. A break and close over that .02 should bring into play a quick test of the .056 and .0085 levels. Why so, I'm often asked. If one checks the volume of the past when the stock traded up to those levels, the volume was extremely low as compared to recent months. Most all of the stock being accumulated is going into long term shareholder hands imo. There aren't many flippers here in the .015-.017 levels. Most of the flippers and short term holder were left behind in the .006s-.008s. At least that's what we've been hearing from all the whining about those who sold way too soon. Even the few left up here will soon be left behind again. Most of you should know enough about the indicators that I use and share by now, so a quick look at the Big Picture below should be talking good chit to you, lol! GLTA

