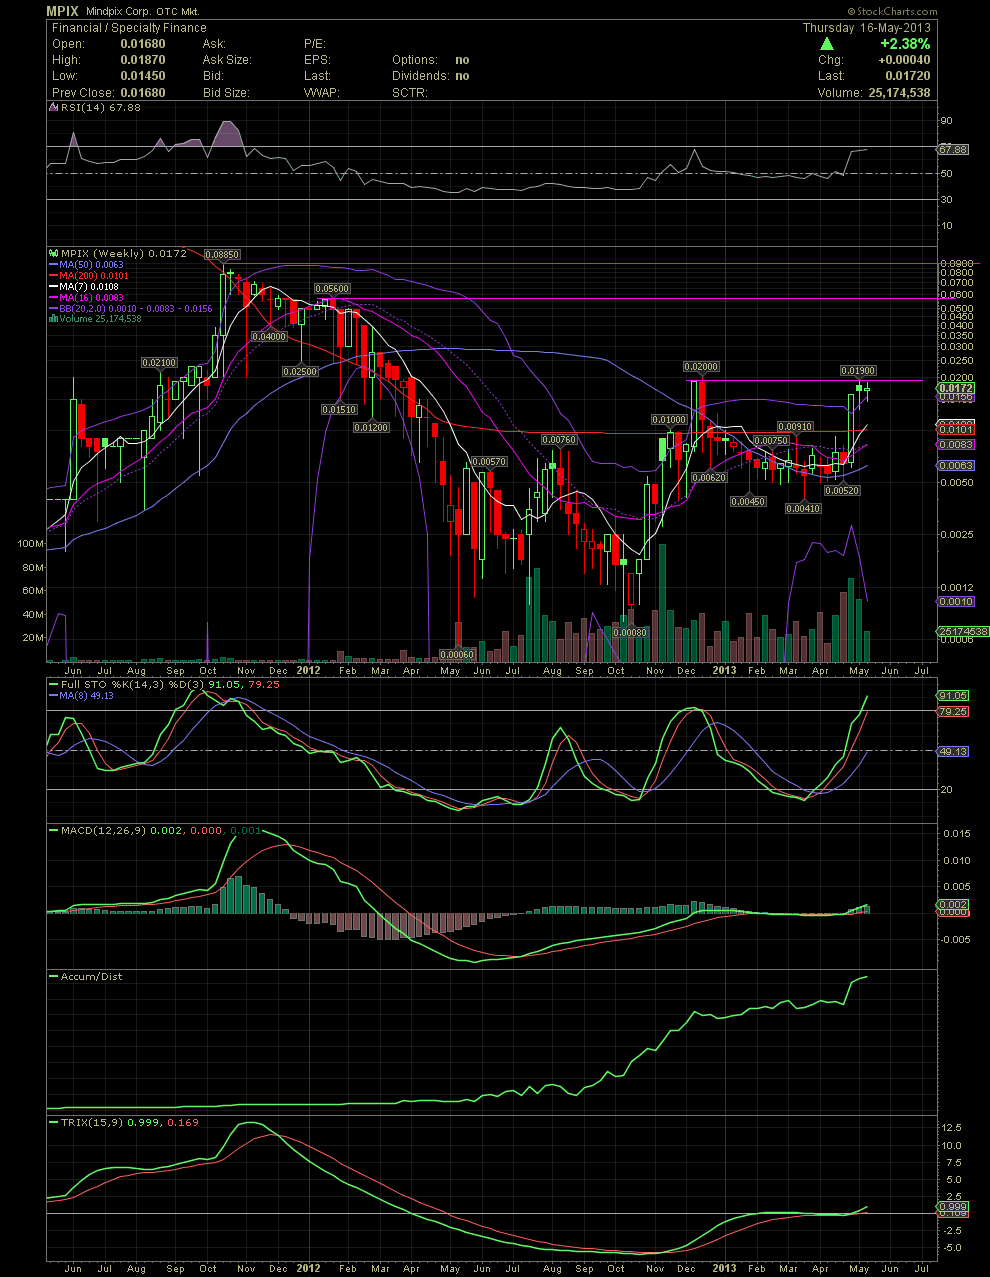
MPIX Weekly Chart ~ The Bigger Picture Continues to Tell the Tale of the Beast That's Coming
As mentioned a couple of weeks ago, the stock will need to undergo some consolidation which might take a few weeks. As the churning continues for a full two weeks, the longer term picture of the MPIX Weekly Chart shows the continued strength building with all the indicators. The last time the TRIX crossed over, MPIX ran from .003s to .0885. Since the current crossing is starting from a share price in the high .01s, could the stock see a similar 3,000% from .005 to .15 over time? No one knows that. But with the new management team in place, should they produce and execute a major event or two, that's exactly what many long term shareholders believe. The various crossings to a buy signal on this weekly chart indicates, to me anyway, that this stock has a long, long way to go on the upside. As always, do your own DD, and especially read the last 8 releases for an indication of what this new company and the world class management team is all about. GLTA

