(Total Views: 52)
Posted On: 02/06/2025 2:23:57 AM
Post# of 469

4) 1911 Gold - Trade Data, Technical Analysis .............................................
=====================================================
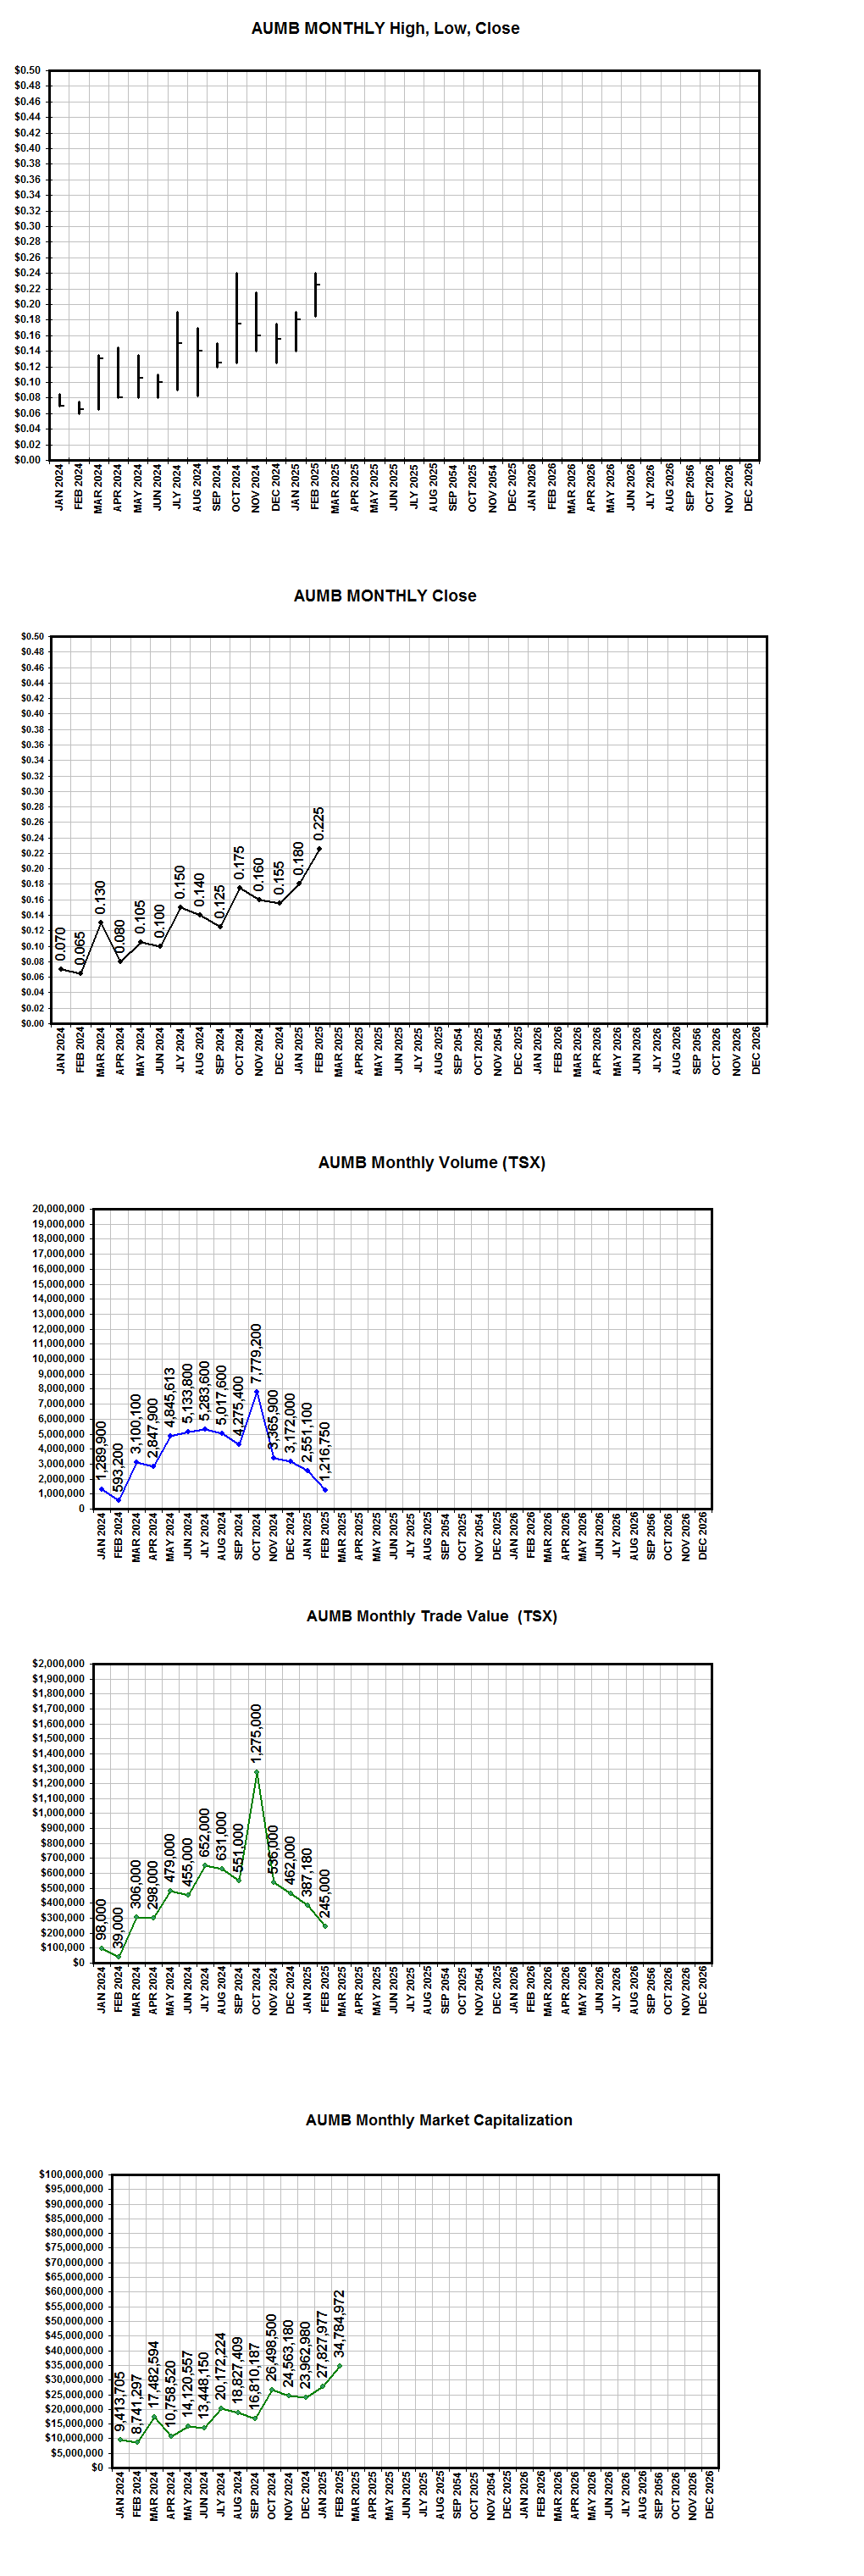
Monthly High, Low, Close, Volume, Trade Value, Market Capitalization
=====================================================
As of Feb 4, 2025
Declining volume corroborates very well with the criteria for Cup-And-Handle formation.
https://investorshangout.com/images/MYImages/...4,2025.png
AUMB monthly 1year (live chart)
https://bigcharts.marketwatch.com/advchart/fr...=320&s
======================
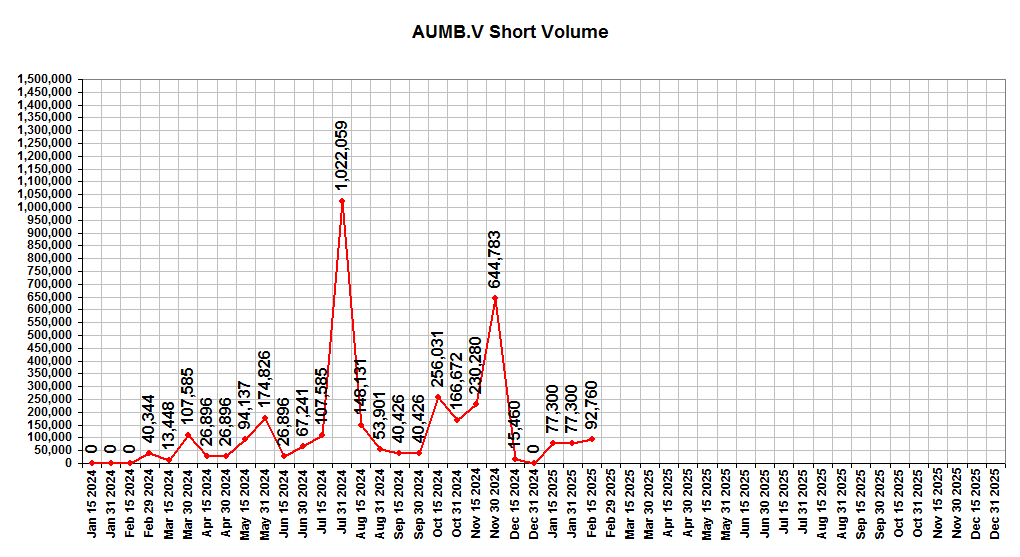
AUMB.TSXV Short Interest
======================
As of Feb 4, 2025
https://investorshangout.com/images/MYImages/...volume.png
===================================
Bid, Ask, Last Trade, Volume, Buyers, Sellers
===================================
AUMB.TSXV
https://www.stockwatch.com/Quote/Detail.aspx?C:AUMB.V
AUMBF.OTC
https://www.stockwatch.com/Quote/Detail.aspx?U:AUMBF
============
Weekly Charts
============
Gold weekly
https://bigcharts.marketwatch.com/advchart/fr...=2&tim
US Dollar Index weekly
https://stockcharts.com/h-sc/ui?s=%24USD&...e_vignette
XAU weekly
https://stockcharts.com/h-sc/ui?s=%24XAU&...4158123608
Canada: AUMB.TSXV weekly (in Canadian Dollar)
https://stockcharts.com/h-sc/ui?s=AUMB.V&...0459232325
USA: AUMBF.OTC weekly (in US Dollar)
https://stockcharts.com/h-sc/ui?s=AUMBF&p...1124264053
Germany: 2KY.FRA (in Euro)
https://markets.ft.com/data/equities/tearshee...?s=2KY:FRA
=============
Monthly Charts
=============
Gold monthly
https://bigcharts.marketwatch.com/advchart/fr...320&si
US Dollar monthly
https://bigcharts.marketwatch.com/advchart/fr...=54&y=
XAU monthly
https://bigcharts.marketwatch.com/advchart/fr...amp;size=2
XAU quarterly
https://bigcharts.marketwatch.com/advchart/fr...p;state=10
AUMB.TSXV quarterly (in Canadian Dollar)
https://bigcharts.marketwatch.com/advchart/fr...e=320&
AUMB.TSXV monthly (in Canadian Dollar)
https://bigcharts.marketwatch.com/advchart/fr...e=320&
AUMBF.OTC monthly (in US Dollar)
https://bigcharts.marketwatch.com/advchart/fr...mp;state=8
~~~~~~~~~~~~~~~~~~~~~~~~~~~~~~~~~~~~~~~~~~~~~~~~~~~~~~~~~~~~~~
==========================
Technical Analysis and Forecast
==========================
Dow Jones Industrial Average (DJIA)
https://investorshangout.com/images/MYImages/...3_DJIA.gif
DJIA 100-year chart (Inflation adjusted prices)
https://www.macrotrends.net/1319/dow-jones-10...ical-chart
~~~~~~~~~~~~~~~~~~~~~~~~~~~~~~~~~~~~~~~~~~~~~~~~~
GOLD - Future scenario as of December, 2021:
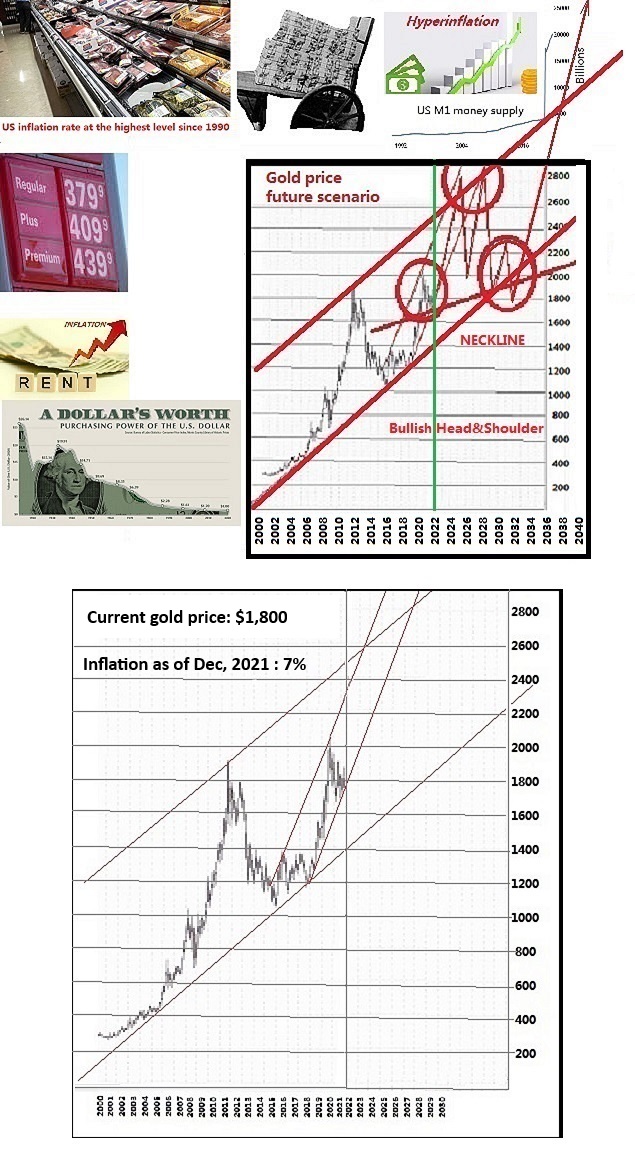
https://investorshangout.com/images/MYImages/...enario.jpg
Revised future scenario as of December, 2024:
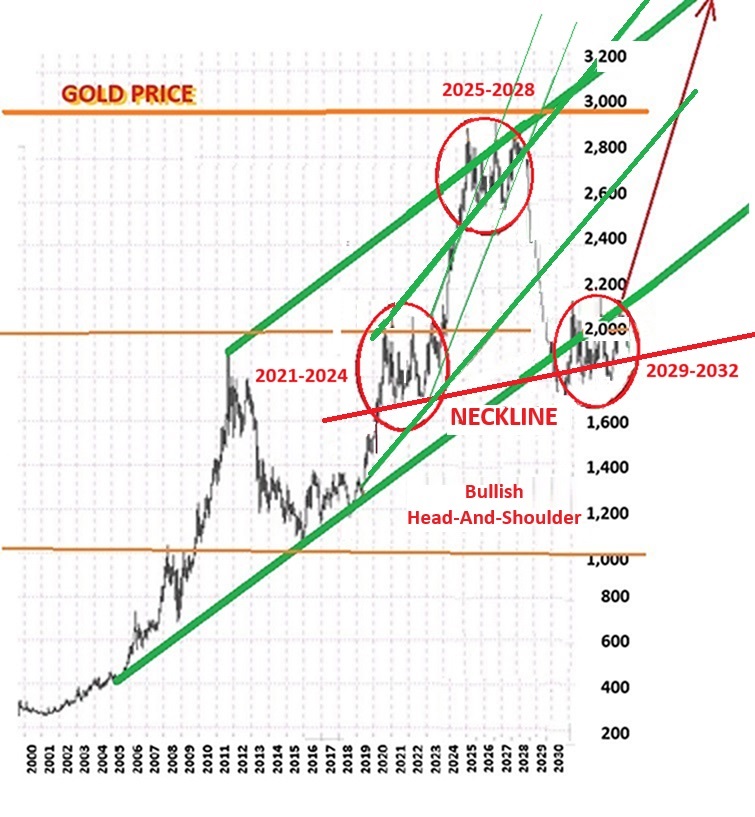
https://investorshangout.com/images/MYImages/...recast.jpg
46-years gold price (live chart)
https://mrci.com/pdf/gc.pdf
~~~~~~~~~~~~~~~~~~~~~~~~~~~~~~~~~~~~~~~~~~~~~~~~~~
XAU quarterly - Technical Analysis
https://investorshangout.com/images/MYImages/...6_XAUQ.gif
XAU quarterly (live chart)
https://bigcharts.marketwatch.com/advchart/fr...p;state=10
~~~~~~~~~~~~~~~~~~~~~~~~~~~~~~~~~~~~~~~~~~~~~~~~~~~~~~
US DOLLAR, XAU and AUMB Monthly juxtaposition
https://investorshangout.com/images/MYImages/...,AUMBM.gif
US Dollar monthly 10years (live chart)
https://bigcharts.marketwatch.com/advchart/fr...=54&y=
XAU monthly 10years (live chart)
https://bigcharts.marketwatch.com/advchart/fr...mp;state=8
AUMB monthly 10years (live chart)
https://bigcharts.marketwatch.com/advchart/fr...mp;state=8
~~~~~~~~~~~~~~~~~~~~~~~~~~~~~~~~~~~~~~~~~~~~~~~~~~~~~
XAU, AUMB Weekly juxtaposition
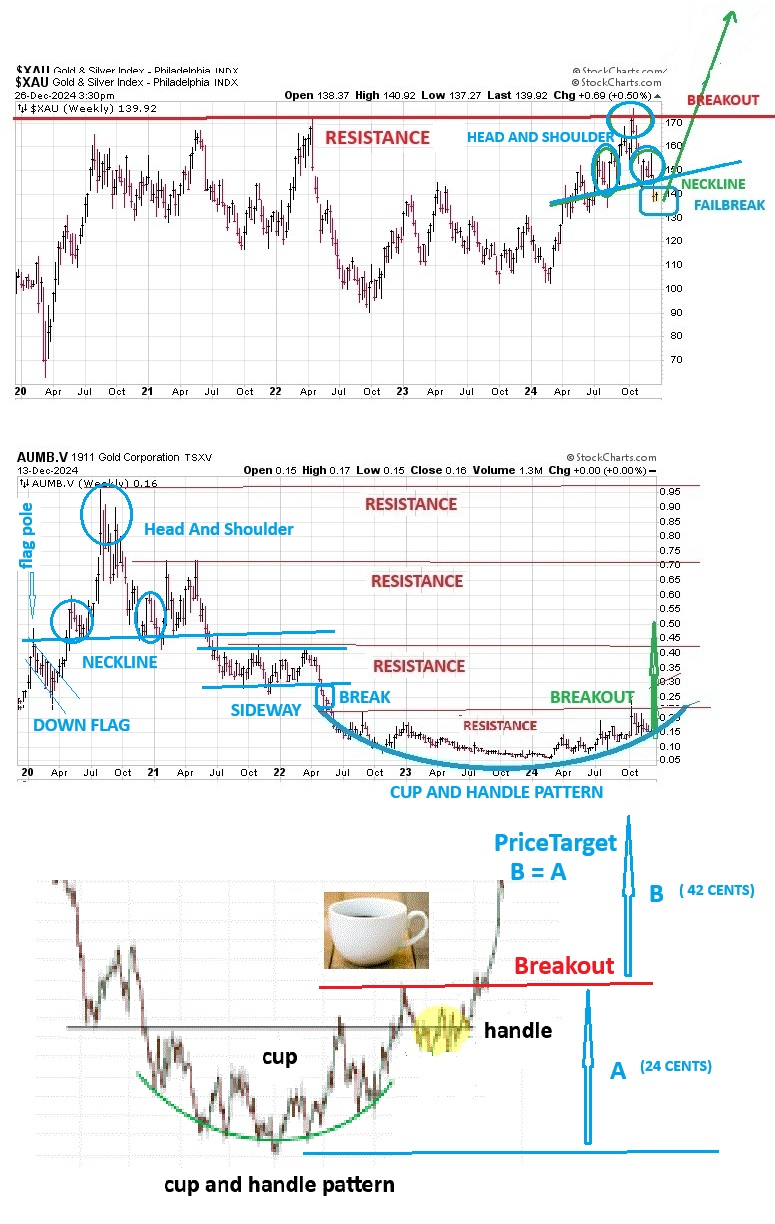
https://investorshangout.com/images/MYImages/...MBW5yr.jpg
XAU weekly 5years (live chart)
https://stockcharts.com/h-sc/ui?s=%24XAU&...0950278014
AUMB weekly 5years (live chart)
https://stockcharts.com/h-sc/ui?s=AUMB.V&...2963243620
AUMB weekly 3years (live chart)
https://stockcharts.com/h-sc/ui?s=AUMB.V&...0459232325
AUMBF weekly 3years (live chart)
https://stockcharts.com/h-sc/ui?s=AUMBF&p...1124264053
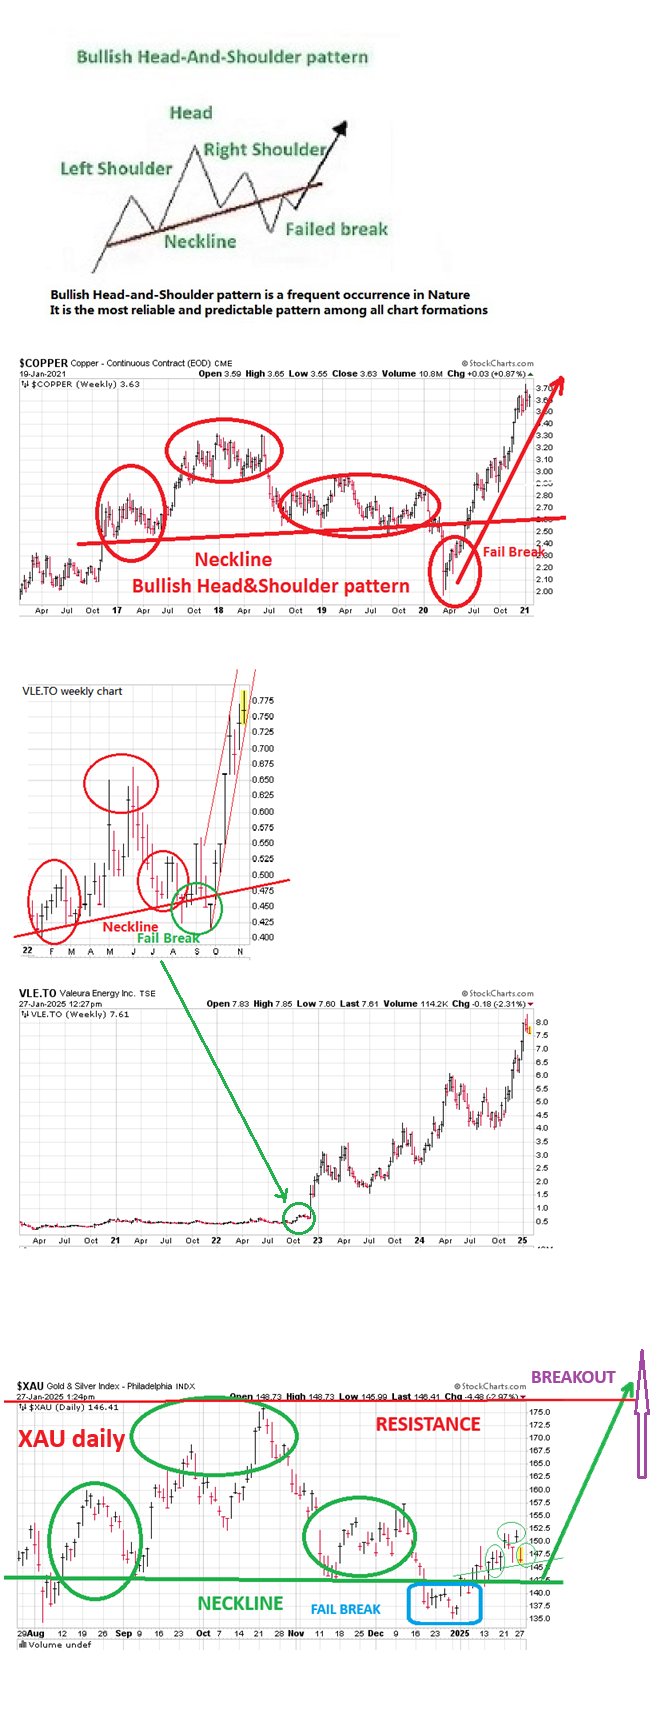
Historical bullish Head & Shoulder patterns
https://investorshangout.com/images/MYImages/...tterns.png
46-year Copper price (live chart) (scale in cents per pound)
https://www.mrci.com/pdf/hg.pdf
XAU daily (live chart)
https://stockcharts.com/h-sc/ui?s=%24XAU&...8449525445
Analysis of Cup And Handle pattern
https://www.investopedia.com/terms/c/cupandhandle.asp
=====================================================
Monthly High, Low, Close, Volume, Trade Value, Market Capitalization
=====================================================
As of Feb 4, 2025
Declining volume corroborates very well with the criteria for Cup-And-Handle formation.
https://investorshangout.com/images/MYImages/...4,2025.png
AUMB monthly 1year (live chart)
https://bigcharts.marketwatch.com/advchart/fr...=320&s
======================
AUMB.TSXV Short Interest
======================
As of Feb 4, 2025
https://investorshangout.com/images/MYImages/...volume.png
===================================
Bid, Ask, Last Trade, Volume, Buyers, Sellers
===================================
AUMB.TSXV
https://www.stockwatch.com/Quote/Detail.aspx?C:AUMB.V
AUMBF.OTC
https://www.stockwatch.com/Quote/Detail.aspx?U:AUMBF
============
Weekly Charts
============
Gold weekly
https://bigcharts.marketwatch.com/advchart/fr...=2&tim
US Dollar Index weekly
https://stockcharts.com/h-sc/ui?s=%24USD&...e_vignette
XAU weekly
https://stockcharts.com/h-sc/ui?s=%24XAU&...4158123608
Canada: AUMB.TSXV weekly (in Canadian Dollar)
https://stockcharts.com/h-sc/ui?s=AUMB.V&...0459232325
USA: AUMBF.OTC weekly (in US Dollar)
https://stockcharts.com/h-sc/ui?s=AUMBF&p...1124264053
Germany: 2KY.FRA (in Euro)
https://markets.ft.com/data/equities/tearshee...?s=2KY:FRA
=============
Monthly Charts
=============
Gold monthly
https://bigcharts.marketwatch.com/advchart/fr...320&si
US Dollar monthly
https://bigcharts.marketwatch.com/advchart/fr...=54&y=
XAU monthly
https://bigcharts.marketwatch.com/advchart/fr...amp;size=2
XAU quarterly
https://bigcharts.marketwatch.com/advchart/fr...p;state=10
AUMB.TSXV quarterly (in Canadian Dollar)
https://bigcharts.marketwatch.com/advchart/fr...e=320&
AUMB.TSXV monthly (in Canadian Dollar)
https://bigcharts.marketwatch.com/advchart/fr...e=320&
AUMBF.OTC monthly (in US Dollar)
https://bigcharts.marketwatch.com/advchart/fr...mp;state=8
~~~~~~~~~~~~~~~~~~~~~~~~~~~~~~~~~~~~~~~~~~~~~~~~~~~~~~~~~~~~~~
==========================
Technical Analysis and Forecast
==========================
Dow Jones Industrial Average (DJIA)
https://investorshangout.com/images/MYImages/...3_DJIA.gif
DJIA 100-year chart (Inflation adjusted prices)
https://www.macrotrends.net/1319/dow-jones-10...ical-chart
~~~~~~~~~~~~~~~~~~~~~~~~~~~~~~~~~~~~~~~~~~~~~~~~~
GOLD - Future scenario as of December, 2021:
https://investorshangout.com/images/MYImages/...enario.jpg
Revised future scenario as of December, 2024:
https://investorshangout.com/images/MYImages/...recast.jpg
46-years gold price (live chart)
https://mrci.com/pdf/gc.pdf
~~~~~~~~~~~~~~~~~~~~~~~~~~~~~~~~~~~~~~~~~~~~~~~~~~
XAU quarterly - Technical Analysis
https://investorshangout.com/images/MYImages/...6_XAUQ.gif
XAU quarterly (live chart)
https://bigcharts.marketwatch.com/advchart/fr...p;state=10
~~~~~~~~~~~~~~~~~~~~~~~~~~~~~~~~~~~~~~~~~~~~~~~~~~~~~~
US DOLLAR, XAU and AUMB Monthly juxtaposition
https://investorshangout.com/images/MYImages/...,AUMBM.gif
US Dollar monthly 10years (live chart)
https://bigcharts.marketwatch.com/advchart/fr...=54&y=
XAU monthly 10years (live chart)
https://bigcharts.marketwatch.com/advchart/fr...mp;state=8
AUMB monthly 10years (live chart)
https://bigcharts.marketwatch.com/advchart/fr...mp;state=8
~~~~~~~~~~~~~~~~~~~~~~~~~~~~~~~~~~~~~~~~~~~~~~~~~~~~~
XAU, AUMB Weekly juxtaposition
https://investorshangout.com/images/MYImages/...MBW5yr.jpg
XAU weekly 5years (live chart)
https://stockcharts.com/h-sc/ui?s=%24XAU&...0950278014
AUMB weekly 5years (live chart)
https://stockcharts.com/h-sc/ui?s=AUMB.V&...2963243620
AUMB weekly 3years (live chart)
https://stockcharts.com/h-sc/ui?s=AUMB.V&...0459232325
AUMBF weekly 3years (live chart)
https://stockcharts.com/h-sc/ui?s=AUMBF&p...1124264053
Historical bullish Head & Shoulder patterns
https://investorshangout.com/images/MYImages/...tterns.png
46-year Copper price (live chart) (scale in cents per pound)
https://www.mrci.com/pdf/hg.pdf
XAU daily (live chart)
https://stockcharts.com/h-sc/ui?s=%24XAU&...8449525445
Analysis of Cup And Handle pattern
https://www.investopedia.com/terms/c/cupandhandle.asp
Scroll down for more posts ▼