Posted On: 04/01/2013 7:03:22 AM
Post# of 2561

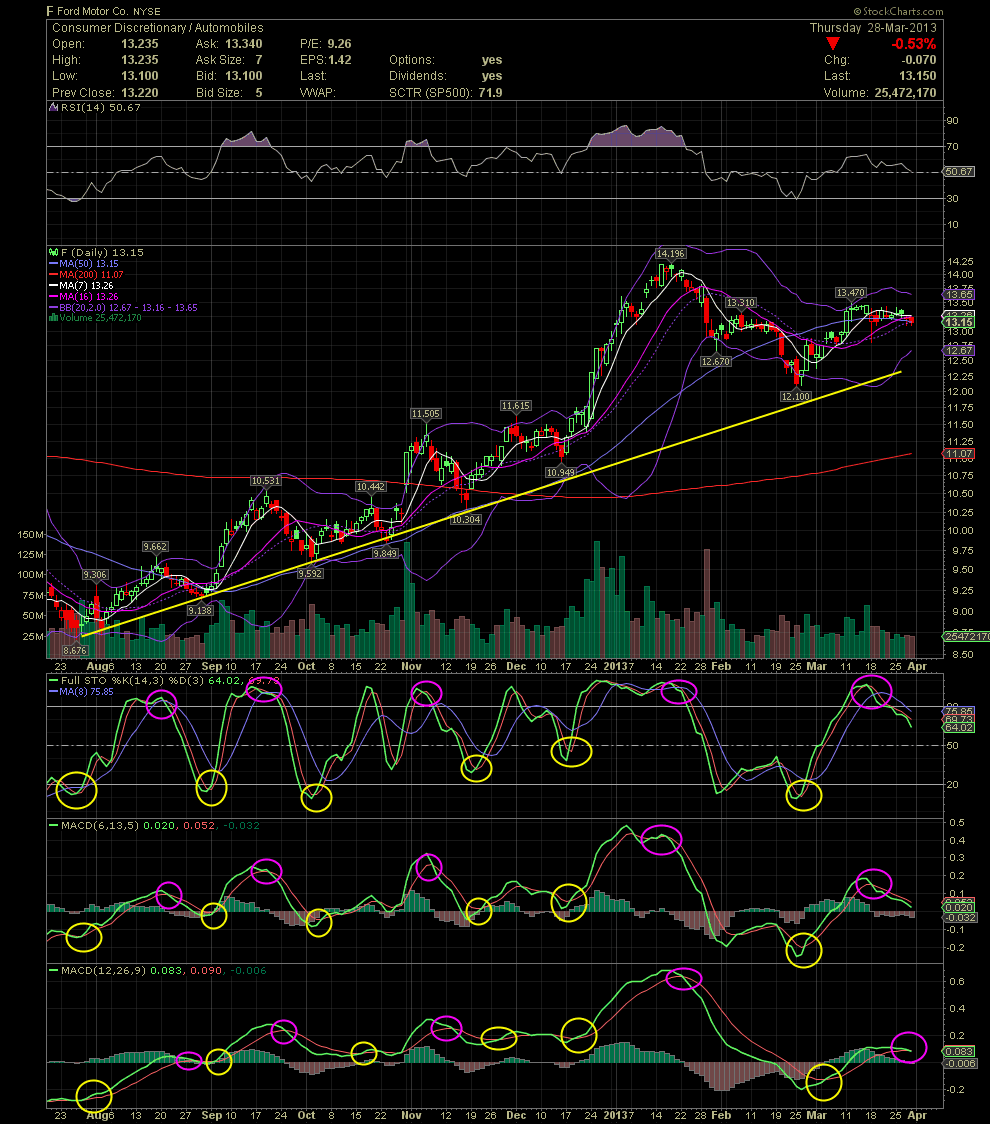
F Daily Chart..... A good chart to study using the basic indicators and the moves.
The recent short term negative moves of the FullSto and shorter term MACD, haven't seen the stock price drop much. But since one never knows who far a stock might fall during its downtrend, sometimes the best move is to just wait until there's more clarity or waiting for the indicators to reset for another buy signal. Remember, charting and the indicators are simply tools to help one who is swing trading the trends. They aren't guarantees of tops and bottoms, but they do help. Technical analysis works well with big board stocks, but a lot more difficult with penny stocks. And as always, anything I post here is just thoughts and opinion. GLTA