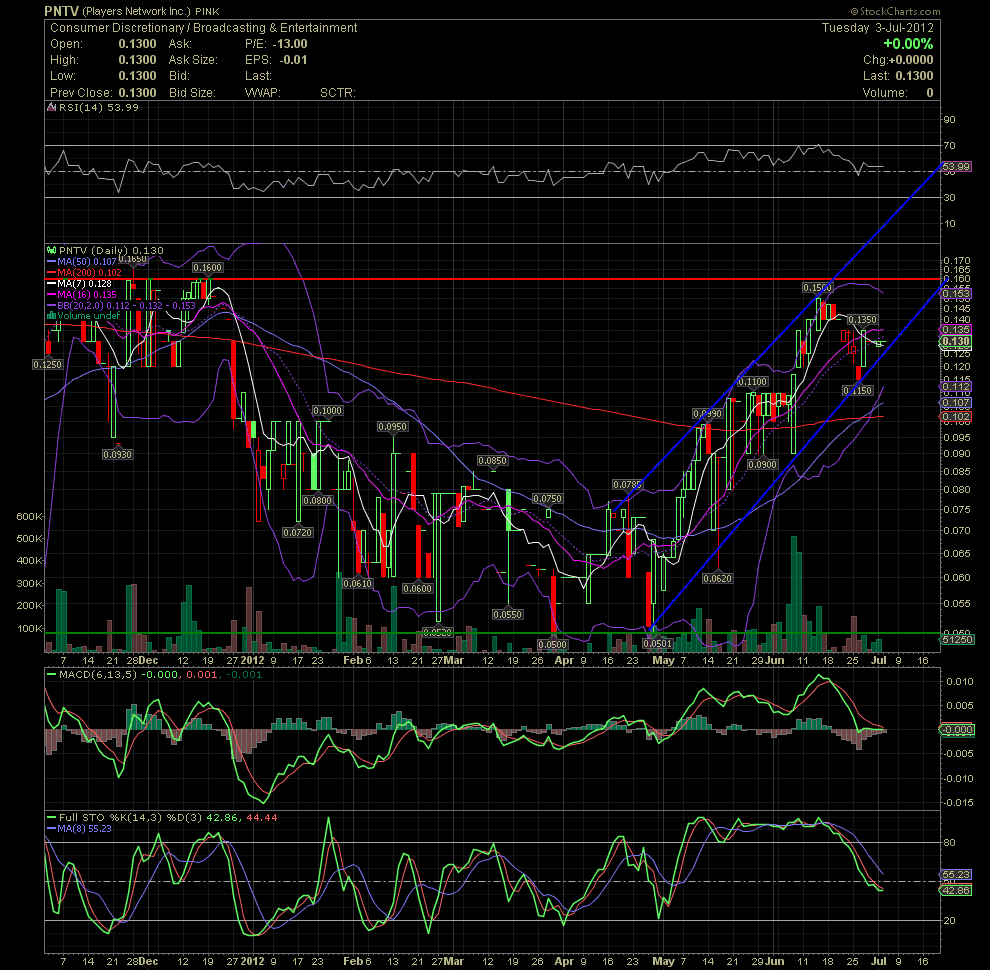
PNTV Daily Chart...... Ready for the next leg up?
Been accumulating PNTV since May 1 in the .05 range. While I believe PNTV will see the low dollars over the next 1-2 years, there will be many more opportunities to swing a few and/or add on the dips. One such dip is now imo.
Since my last chart, PNTV has dropped on very low volume. I've added almost 150k shares with a few friends in the .12-.13 range over the last week. The RSI is holding above 50 after flirting with the 70 level during the climb from .0501. The MACD has leveled out at the zero line after declining from the some very overbought levels of mid June. The same story for the FullSto. All the indicators that I follow are setting up for a buy signal. So I've been 'cheating' and accumulating a bit early.
Please note the rising channel that's been in effect since May 1. Should the stock price break above the horizontal resistance line (red) at .16, I think PNTV could easily trade into the .20s. This daily is a pretty good looking chart!

