Investors Hangout Stock Message Boards Logo
  • Home
  • Mailbox
  • Boards
  • Favorites
  • Whats Hot!
  • Login - Join Now!
Big Tuna's Stocks
Posted On: 03/19/2013 12:58:36 AM
Post# of 2561
Avatar
Posted By: Big Tuna
Re: Big Tuna #148

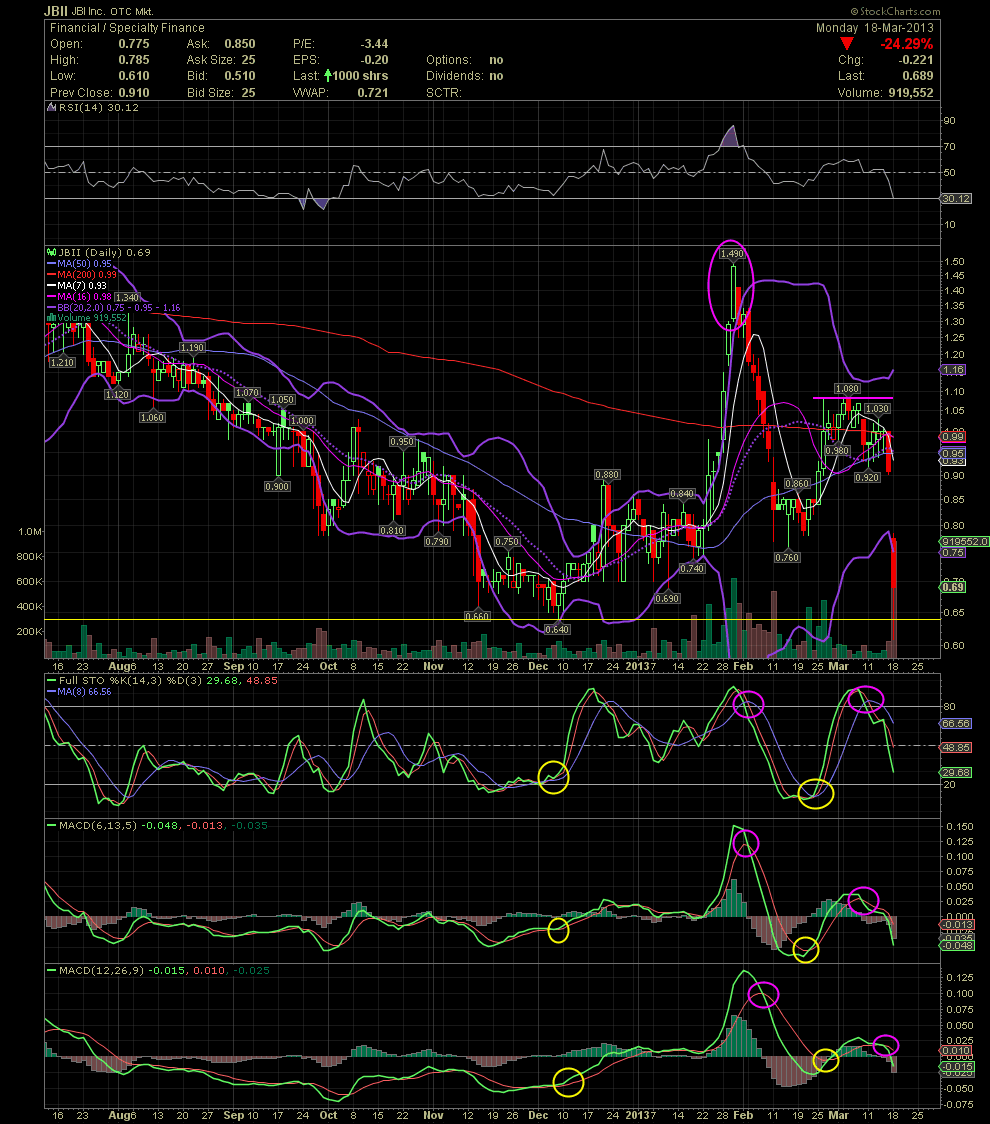
JBII Daily Chart....... Look Out Below


Per my last JBII chart, I thought that the low .80s would be an opportunity to re-enter the stock. Fortunately for those sitting on the sidelines, the gap down to an open of .775, thus breaking under any low .80s support, should have kept one from jumping in. The lows of the December .60s may or may not offer support. Sometimes the best trade is no trade. Although the chart is quickly becoming oversold, let's wait for the indicators to settle into a better indication that a bottom might be in. Also, since there isn't nearly as much trading history on this daily chart, I'll post a weekly chart next which might offer a level that JBII might settle at. GLTA


(0)
(0)


  • New Post - Investors HangoutNew Post

  • Public Reply - Investors HangoutPublic Reply

  • Private Reply - Investors HangoutPrivate Reply

  • Board - Investors HangoutBoard

  • More - Investors HangoutMore

  • Keep Post - Investors HangoutKeep Post
  • Report Post - Investors HangoutReport Post
  • Home - Investors HangoutHome
  • Mailbox - Investors HangoutMailbox
  • Boards - Investors HangoutBoards
  • Favorites - Investors HangoutFavorites
  • Whats Hot! - Investors HangoutWhats Hot!
  • Settings - Investors HangoutSettings
  • Login - Investors HangoutLogin
  • Live Site - Investors HangoutLive Site