(Total Views: 612)
Posted On: 01/05/2023 6:57:31 PM
Post# of 88167
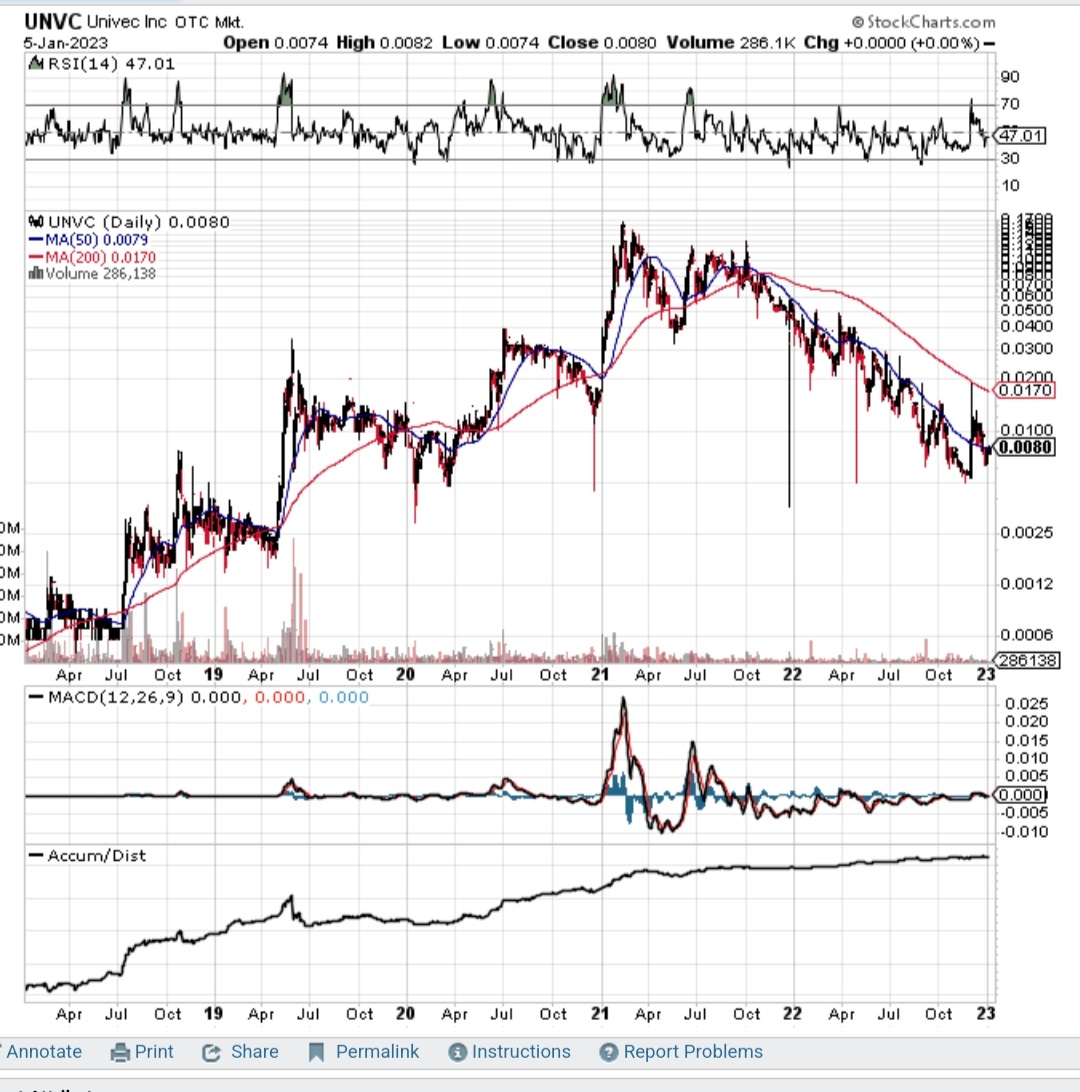
This is 5yr chart and all need to look at the accum/distribution line at bottom always going up!
And the 1yr is more dramatic too!
Now ask how that happen with pps going down? Imo them shares all being sucked up IE the 287 shareholders on record the last Q!
$UNVC TO DOLLARVILLE

And the 1yr is more dramatic too!
Now ask how that happen with pps going down? Imo them shares all being sucked up IE the 287 shareholders on record the last Q!
$UNVC TO DOLLARVILLE


