Posted On: 03/10/2013 2:16:33 PM
Post# of 2561

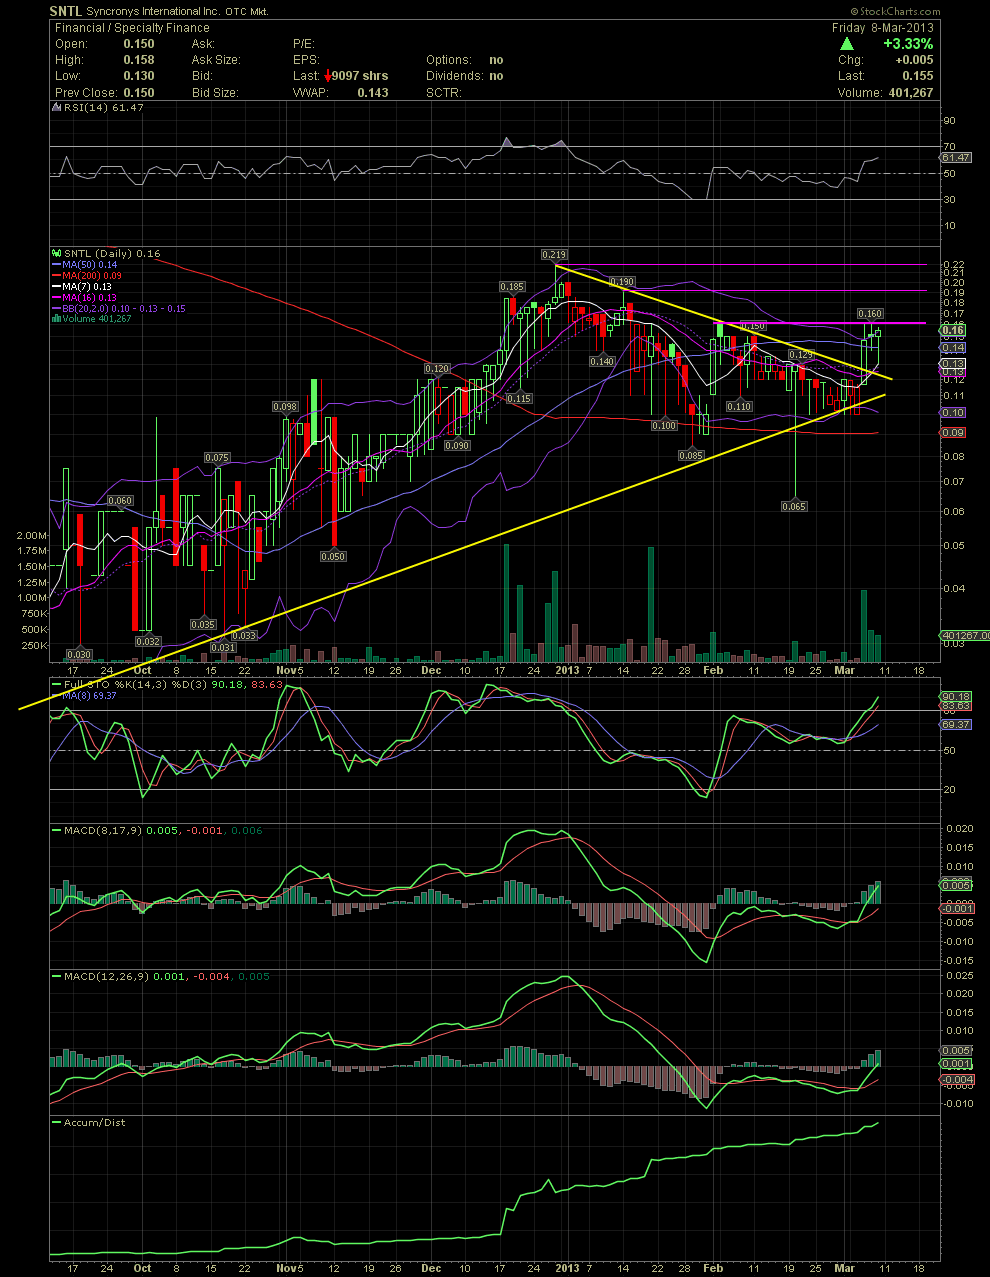
SNTL Daily Chart......... Link Back to My March 6 Chart
As mentioned on March 6, the .15/.16 level would probably show up as resistance. The short term declining tops line, which crossed at approx .13, was taken out on Wednesday. The stock ran a bit, and it was no surprise three attempts at the .15/.16 level halted the stock there. We are now seeing some great separation on the MACDs although the FullSto is already in overbought territory, but it could stay there for a couple of weeks as was the case in December. I've drawn in what I believe will be the next few resistance points should we see SNTL break thru the .16. A close of .22 or better, and SNTL will probably be in play for a move into the .40s. GLTA