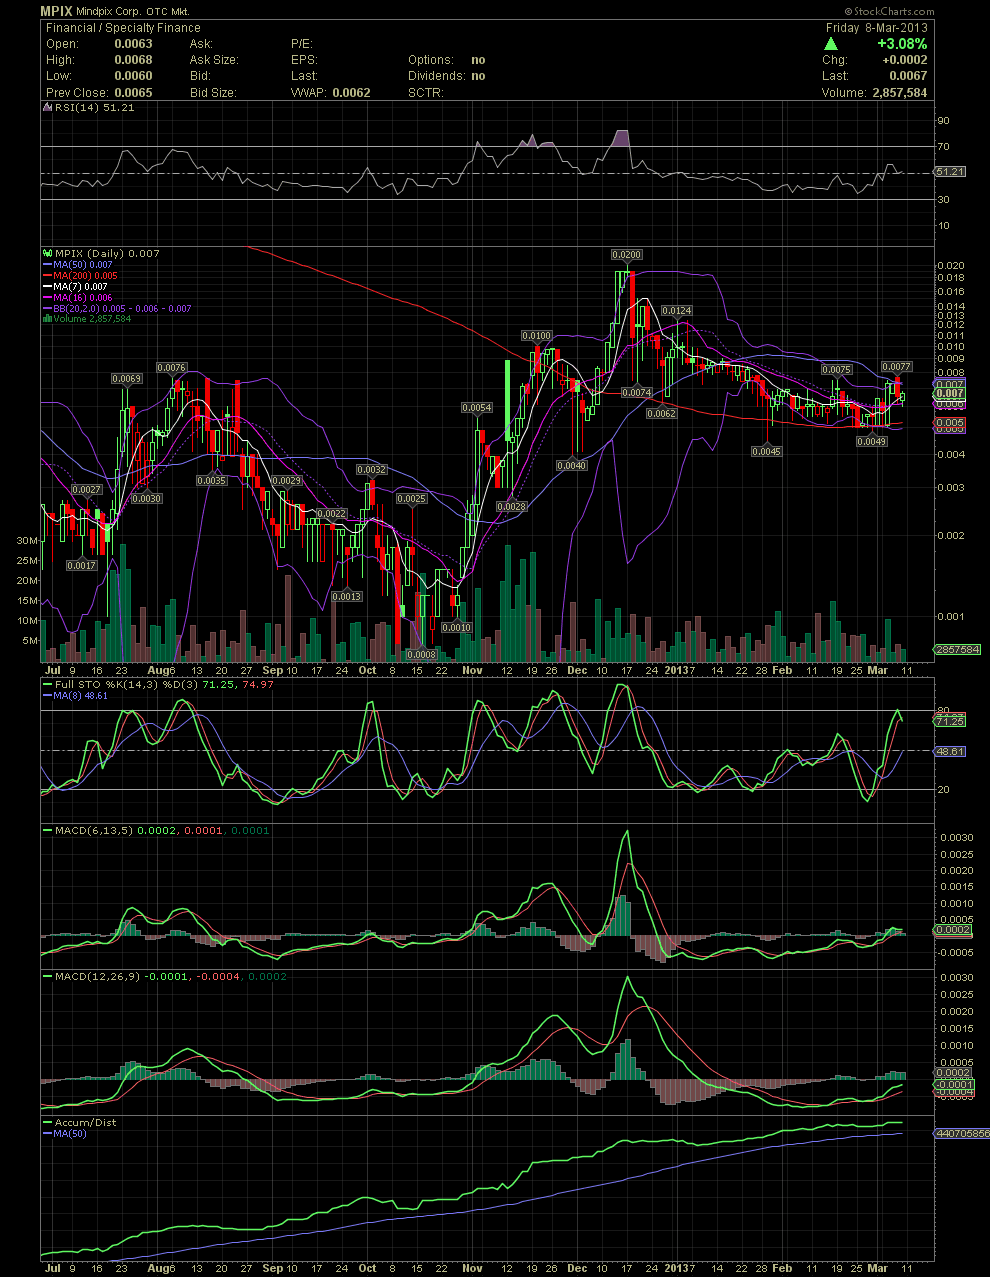
MPIX Daily Chart......... A Reversal at Hand?
Here's a longer term look at MPIX. I was asked about the positioning of the FullSto in relation to it being near its 80 line which is normally considered in slightly overbought territory. No indicator that I use is a 'stand on its own' indicator. Rather, ever indicator is just one of many that I use in order to assist me in trying to figure out the next direction of a stock. What is important to note in the current levels of indicators is their relationship to each other and how the stock was trading. If one looks at the previous three times that the FullSto was near or above the 80 line, the stock actually moved from .002 to .02 from Nov to mid Dec. Study the positions of the MACDs during the same period. When the FullSto hit the 80 line the first time, both MACDs were barely above their zero lines, so they still had a long way to run. During the second run of late Nov, the FullSto once again topped out. Since the MACDs were correcting from higher levels, the stock also had more to fall as it had already moved from .001 to .01. It wasn't until the third move of the FullSto into overbought territory when both MACDs also ran to very high levels. Move forward to today's positioning of the MACDs. One is barely over the zero line while the slower MACD is still under its zero line. Note the gradual rounding of the low as the stock bounced off the MA200. In my opinion, the stock is set to make another multi bagger run as it did from .0008 to .02. GLTA

