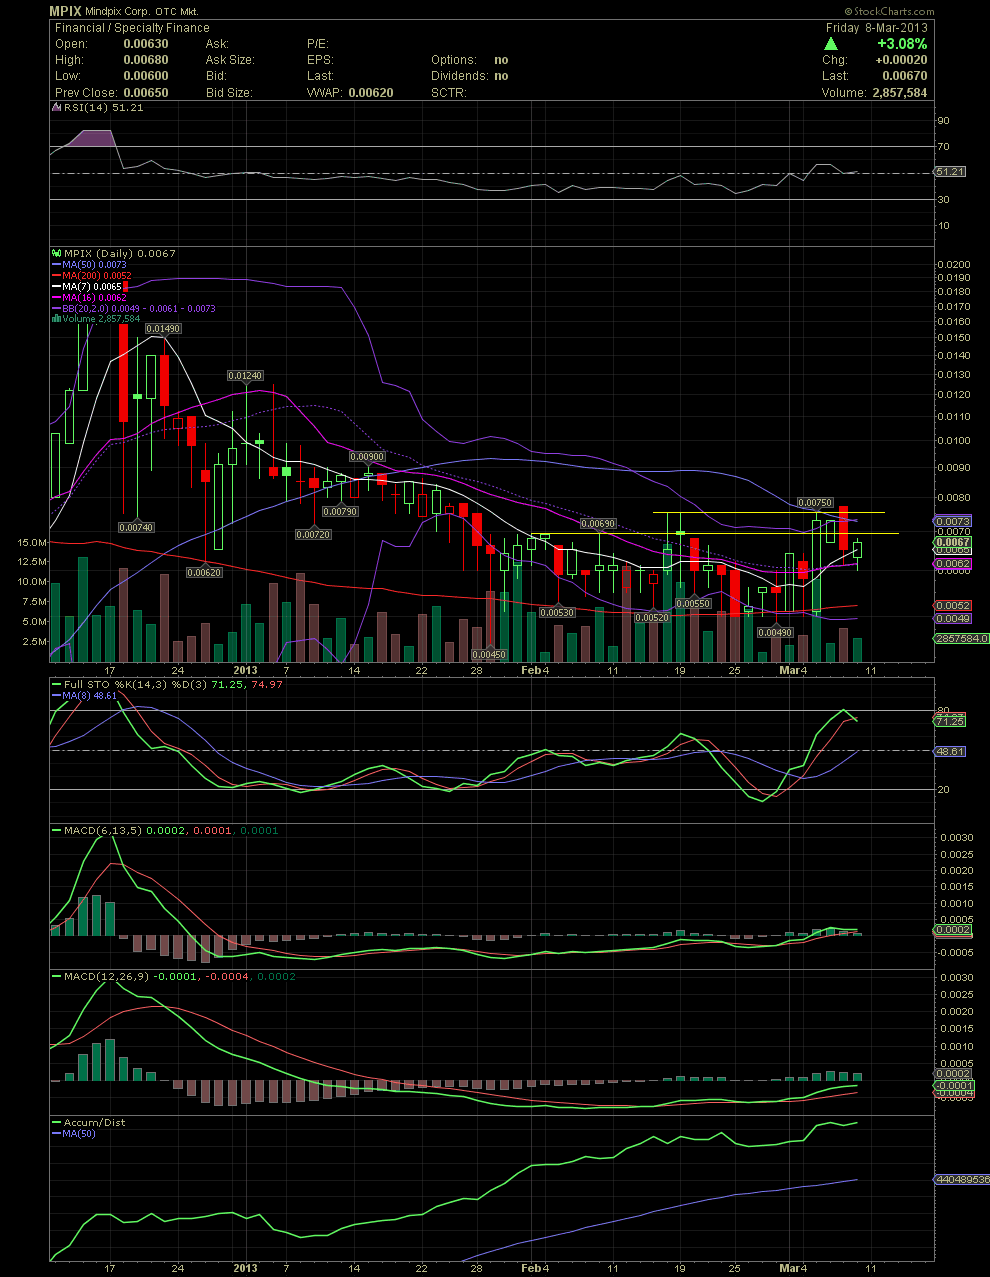
MPIX Daily Chart - 3 Month......... Testing Upside Resistance Levels
Over the last week, MPIX began testing resistance points rather than support level. While the stock continued to test support levels such as the MA200 for months, it was good to see the stock price finally level out and begin curling to the upside for a change. As you can see below the .0069 and .0075 are the short term tops while the .0049/.005 is the support. The remaining have all lined up the way they should be, faster MA's above the slower moving MA's, ie. MA7 over the 10, the 10 over the 16, the 16 over the 20, etc. And they are all beginning to move higher. The only MA that the stock has to get above now is the MA50 which is at .0073. Short term, I would like to see a close of at least .0075. That would be MPIX's highest close since late January and would put into play a test of the .009-.0124 range. GLTA

