Investors Hangout Stock Message Boards Logo
  • Home
  • Mailbox
  • Boards
  • Favorites
  • Whats Hot!
  • Login - Join Now!
Big Tuna's Stocks
Posted On: 02/23/2013 2:42:20 PM
Post# of 2561
Avatar
Posted By: Big Tuna

JBII Daily Chart.......... Link back to my previous JBII chart and thoughts.


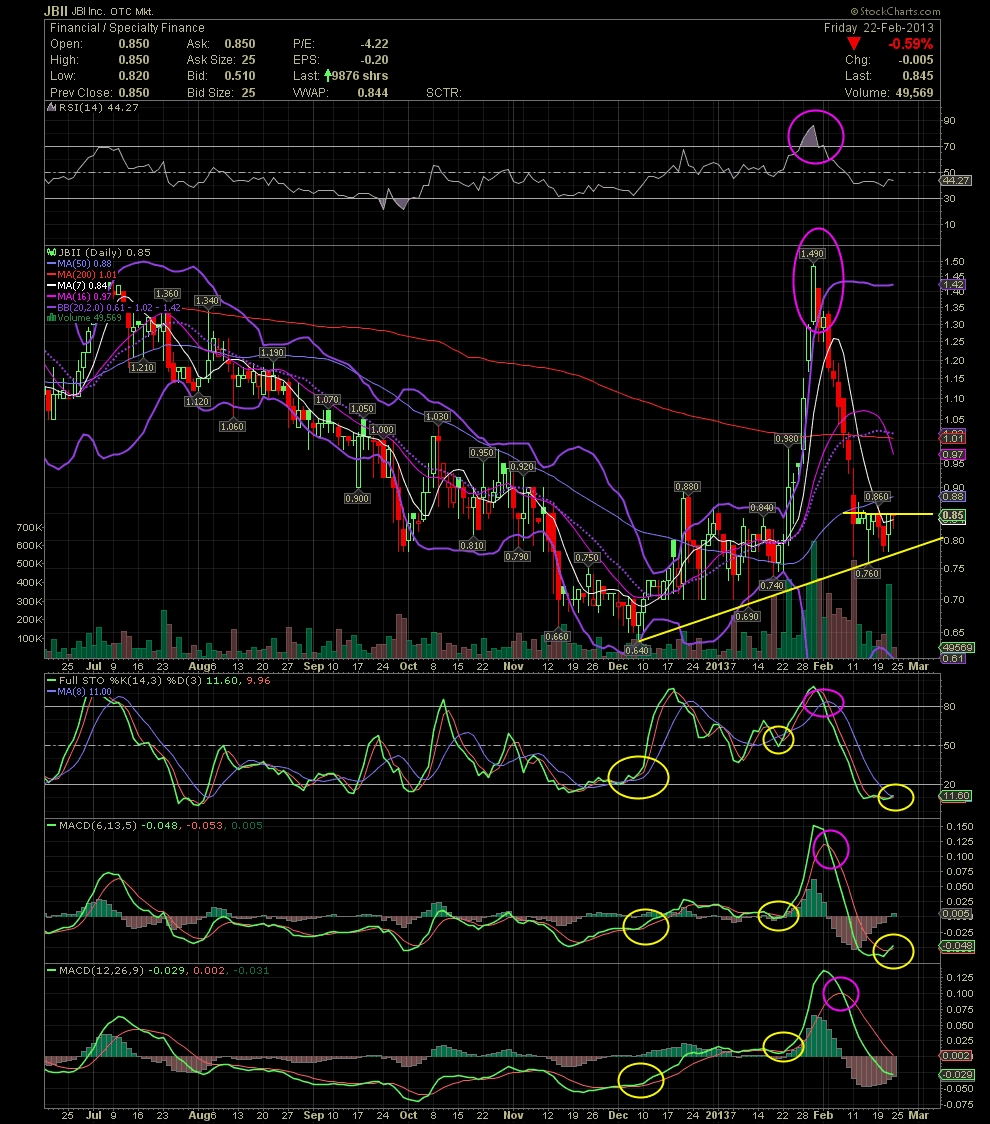
Nothing much new since the last JBII chart I put up, although it seems the stock is trying to base in the high .70s to .85. As one can see, the stock is hanging on to its short term rising support line (yellow). A 'top' at .85 has been developing the last week so we'll keep an eye on any move about it for a possible breakout move. As to the technical indicators, the FullSto and shorter MACD are looking much better, but the longer term MACD has some work to do yet. The positioning of the various moving averages are not anywhere near to where they should be when a technical move is imminent. Simply go back to the last two breakouts and note the positions of the MAs, the FullSto and the MACDs. Currently the charts are still in a sell signal, but things are improving quickly.


(0)
(0)


  • New Post - Investors HangoutNew Post

  • Public Reply - Investors HangoutPublic Reply

  • Private Reply - Investors HangoutPrivate Reply

  • Board - Investors HangoutBoard

  • More - Investors HangoutMore

  • Keep Post - Investors HangoutKeep Post
  • Report Post - Investors HangoutReport Post
  • Home - Investors HangoutHome
  • Mailbox - Investors HangoutMailbox
  • Boards - Investors HangoutBoards
  • Favorites - Investors HangoutFavorites
  • Whats Hot! - Investors HangoutWhats Hot!
  • Settings - Investors HangoutSettings
  • Login - Investors HangoutLogin
  • Live Site - Investors HangoutLive Site