Investors Hangout Stock Message Boards Logo
  • Home
  • Mailbox
  • Boards
  • Favorites
  • Whats Hot!
  • Login - Join Now!
CytoDyn Inc CYDY
(Total Views: 527)
Posted On: 02/25/2021 4:14:01 PM
Post# of 154016
Posted By: ohm20
Re: havasu78 #79964
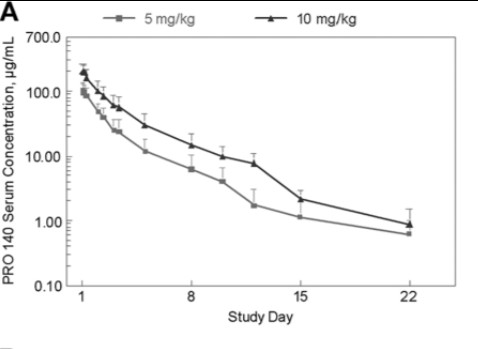
The chart is screwy, it corresponds to the trough concentrations which is the level at the end of a period right before the next shot, which is day 8,15 and 22.


Quote:
Mean trough concentrations for the 162 mg weekly group increased from 1.86 µg/mL on day 8 to 2.89 and 3.55 µg/mL on days 15 and 22, respectively. The corresponding values for the 324 mg weekly group were 5.45, 8.50, and 8.75 µg/mL, respectively.


Here is a chart for the concentration level and drop.

88202005_721.jpg

https://pubmed.ncbi.nlm.nih.gov/20660677/


(1)
(0)


  • New Post - Investors HangoutNew Post

  • Public Reply - Investors HangoutPublic Reply

  • Private Reply - Investors HangoutPrivate Reply

  • Board - Investors HangoutBoard

  • More - Investors HangoutMore

  • Keep Post - Investors HangoutKeep Post
  • Report Post - Investors HangoutReport Post
  • Home - Investors HangoutHome
  • Mailbox - Investors HangoutMailbox
  • Boards - Investors HangoutBoards
  • Favorites - Investors HangoutFavorites
  • Whats Hot! - Investors HangoutWhats Hot!
  • Settings - Investors HangoutSettings
  • Login - Investors HangoutLogin
  • Live Site - Investors HangoutLive Site