Investors Hangout Stock Message Boards Logo
  • Home
  • Mailbox
  • Boards
  • Favorites
  • Whats Hot!
  • Login - Join Now!
CytoDyn Inc CYDY
(Total Views: 1071)
Posted On: 10/01/2020 3:43:45 AM
Post# of 155262
Posted By: DaveEL
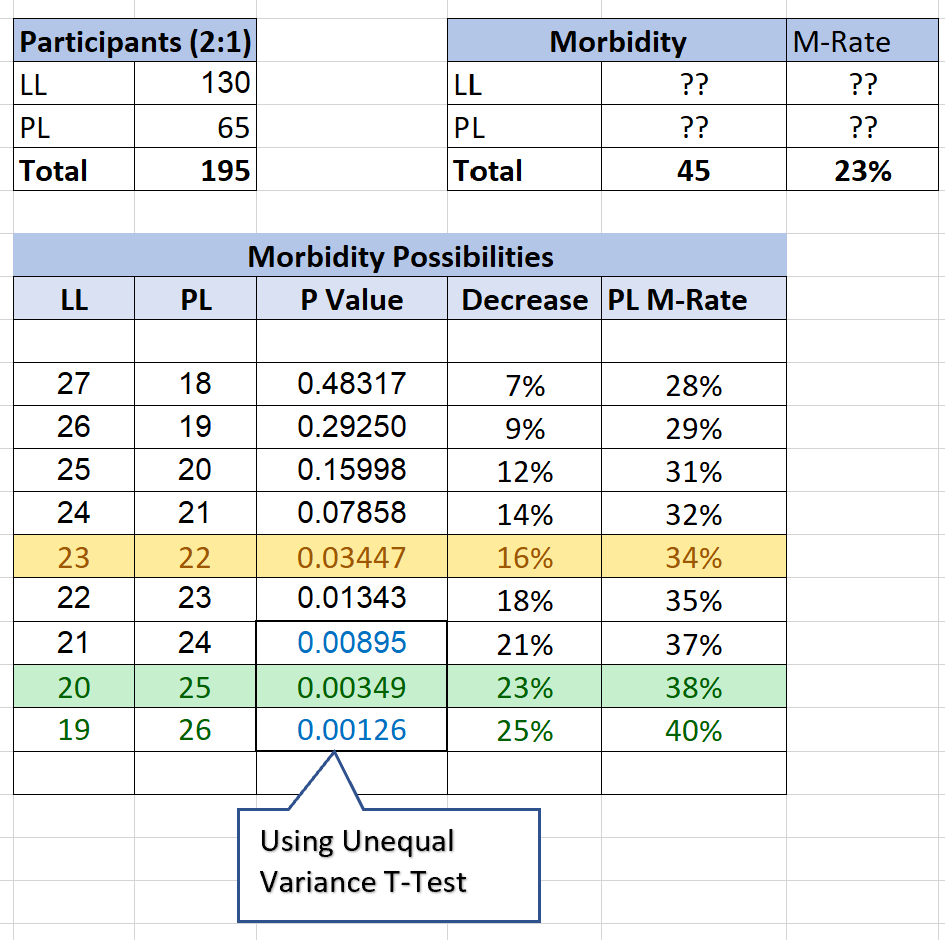
Last update for now. I did a bit of research and reading through some of the FDA documents I found they want a 2 tail p-value (upper and lower ends of the normal curve). I've also refreshed my memory on these excel stats functions and determined I need to use the T-Test function. You need to use the F-Test to determine if the data is too different and then use a different flavor of the T-Test function (which I've highlighted where it changes in the chart). Here's is the updated and hopefully more correct table.

2079243324_LLPValue4.png


(9)
(0)


  • New Post - Investors HangoutNew Post

  • Public Reply - Investors HangoutPublic Reply

  • Private Reply - Investors HangoutPrivate Reply

  • Board - Investors HangoutBoard

  • More - Investors HangoutMore

  • Keep Post - Investors HangoutKeep Post
  • Report Post - Investors HangoutReport Post
  • Home - Investors HangoutHome
  • Mailbox - Investors HangoutMailbox
  • Boards - Investors HangoutBoards
  • Favorites - Investors HangoutFavorites
  • Whats Hot! - Investors HangoutWhats Hot!
  • Settings - Investors HangoutSettings
  • Login - Investors HangoutLogin
  • Live Site - Investors HangoutLive Site