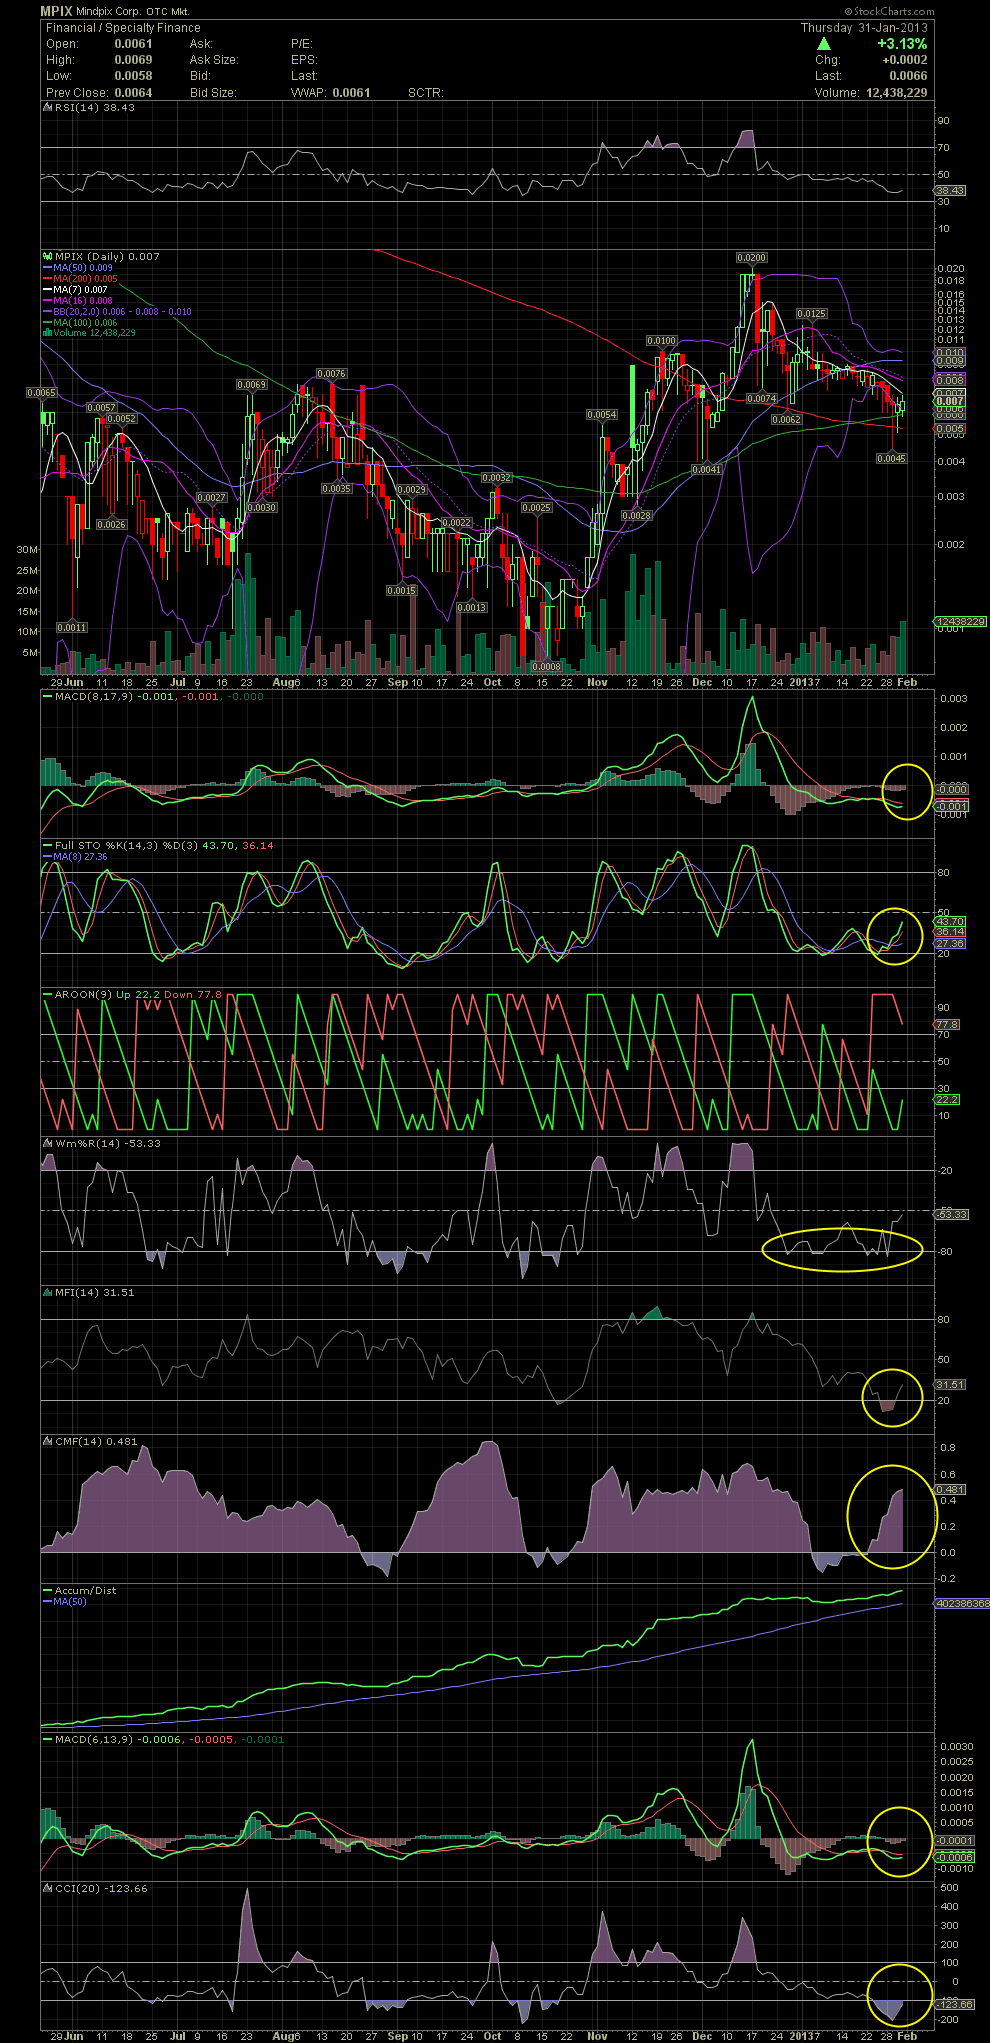
MPIX Daily Chart..........I'm not quite sure yet, but I'm still thinking our bottom is in.
Alright, here's an expanded and more detailed daily chart. There's a lot more information here than I normally post, and there's a lot of squigglies to talk about. From top to bottom, here we go. The RSI (longer term indicator) beginning to curl up from fairly oversold levels. The share price has held above the MA200 and riding the MA100. Both good signs. Unfortunately, as I've noted for many days, the declining stock price has to recapture all the short term moving averages to include the MA7, 10, 16, 20 and 50. Obviously a move above .01 would do just that. MACDs wanting to cross over to a buy signal. FullSto has already done that three days ago. The Willy is moving up from the oversold 80 line. As Ad1 already noted this evening, the MFI is improving nicely. The CMF moved sharply to the upside over the last week. The CCI has also bottomed out. And the long term accumulation of MPIX continues again after some churning during the decline from mid December. Did you all add when the stock was outside the lower bollie? Many of us did in the .004s and .005s. Looking good so far. Although only a guess on my part, I agree with Wifey's analysis in that MPIX is about to break over .01, and that will probably occur next week. And if management delivers another solid release over the next few days, we could see new highs. GLTA

