(Total Views: 351)
Posted On: 05/19/2019 5:40:21 PM
Post# of 156894

I'll show you a little more how I use those buy/resistance points. I always save $ to add when shares are cheap. Last week when people were saying they did a 26.6c offering, I thought it might over sell, I had a order in at 39c, around recent low and then at 37.5c, estimating by my calculations. I put gtc orders in, wanting to add another 20k shares below my cost average. I got the 39c and 37.5c shares on Wednesday.
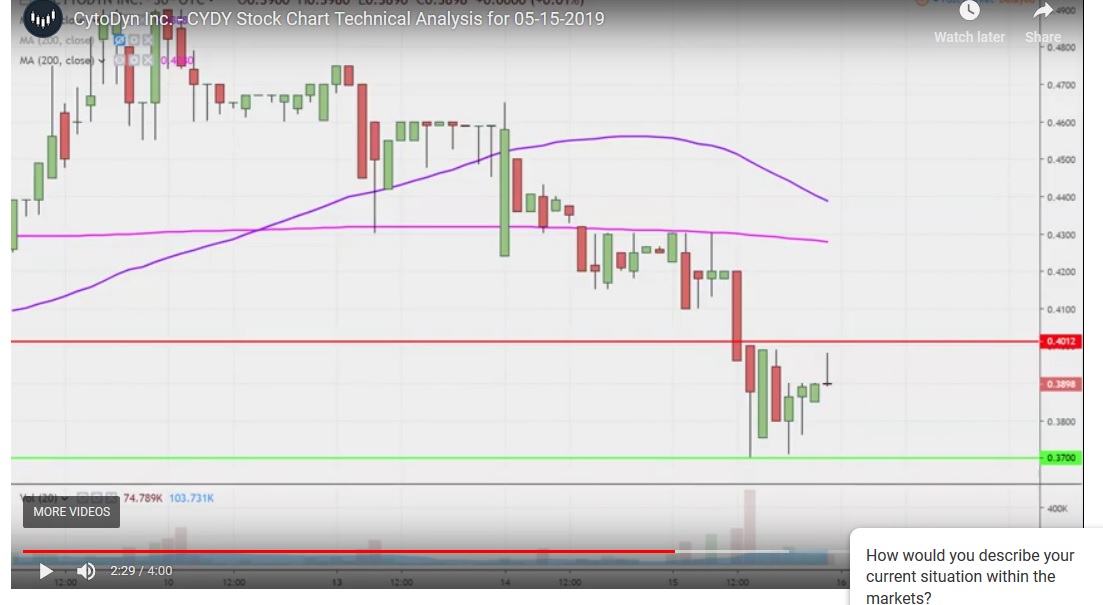
Clay, for example, posted support at 37c, resistance at 40.1c. But nothing special about him there, anyone using the 30m chart will see those same numbers. But I will post his chart for proof, since he posted these numbers Wednesday. On Wednesday night I put another gtc buy order in at 37.52c and got 2500 filled. I was saving some $ if the price broke below 37c. Again, the chart does not tell you what is going to happen, only the price points to look for that they will happen at.
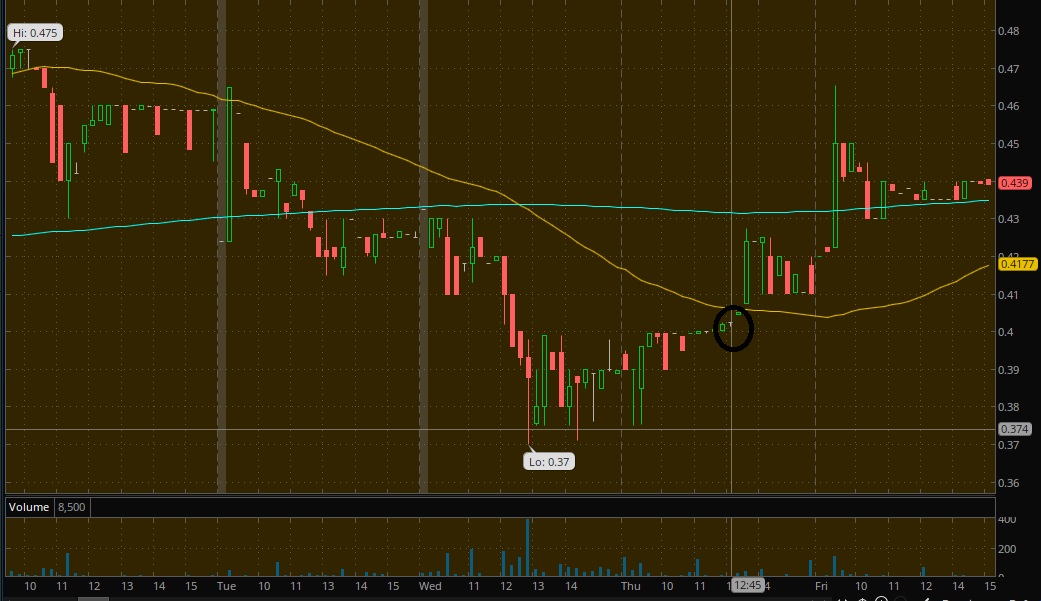
I looked when going lunch at l2 at 12:15 on Thursday, and it looked like 40c was going to break (remember that is the resistance level). I knew if it broke 40c, it would probably spike up-- hopefully to never return --so I quickly bought another 5k. Looked again returning from lunch at 12:45 and 40c had broke slightly, but the market had not reacted yet, the ask was at 40.25c, so I bought another 5k.. giving me 22.5k total new shares, a little more than the 20k shares I wanted, but oh well.
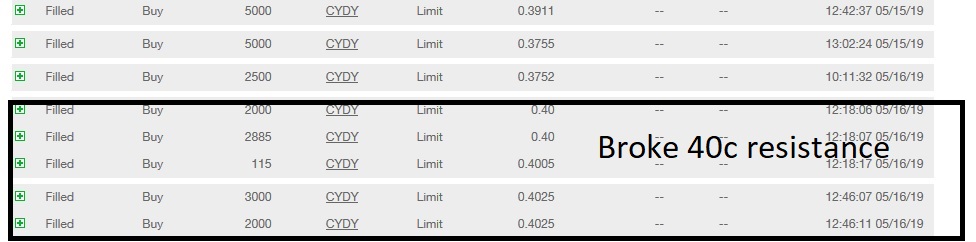
Looked what happen right after 12:46, my purchase when resistance officially broke.
Hopefully the shows the usefulness of charts, with a real world example.
Clay, for example, posted support at 37c, resistance at 40.1c. But nothing special about him there, anyone using the 30m chart will see those same numbers. But I will post his chart for proof, since he posted these numbers Wednesday. On Wednesday night I put another gtc buy order in at 37.52c and got 2500 filled. I was saving some $ if the price broke below 37c. Again, the chart does not tell you what is going to happen, only the price points to look for that they will happen at.
I looked when going lunch at l2 at 12:15 on Thursday, and it looked like 40c was going to break (remember that is the resistance level). I knew if it broke 40c, it would probably spike up-- hopefully to never return --so I quickly bought another 5k. Looked again returning from lunch at 12:45 and 40c had broke slightly, but the market had not reacted yet, the ask was at 40.25c, so I bought another 5k.. giving me 22.5k total new shares, a little more than the 20k shares I wanted, but oh well.
Looked what happen right after 12:46, my purchase when resistance officially broke.
Hopefully the shows the usefulness of charts, with a real world example.