Home
Mailbox
Boards
Favorites
Whats Hot!
Login - Join Now!
Search
Search Type
Board
Post
Member
Transparent Traders
(Total Views: 379)
Posted On: 10/16/2018 7:52:41 AM
Post#
of 4531
Posted By:
Pharaoh
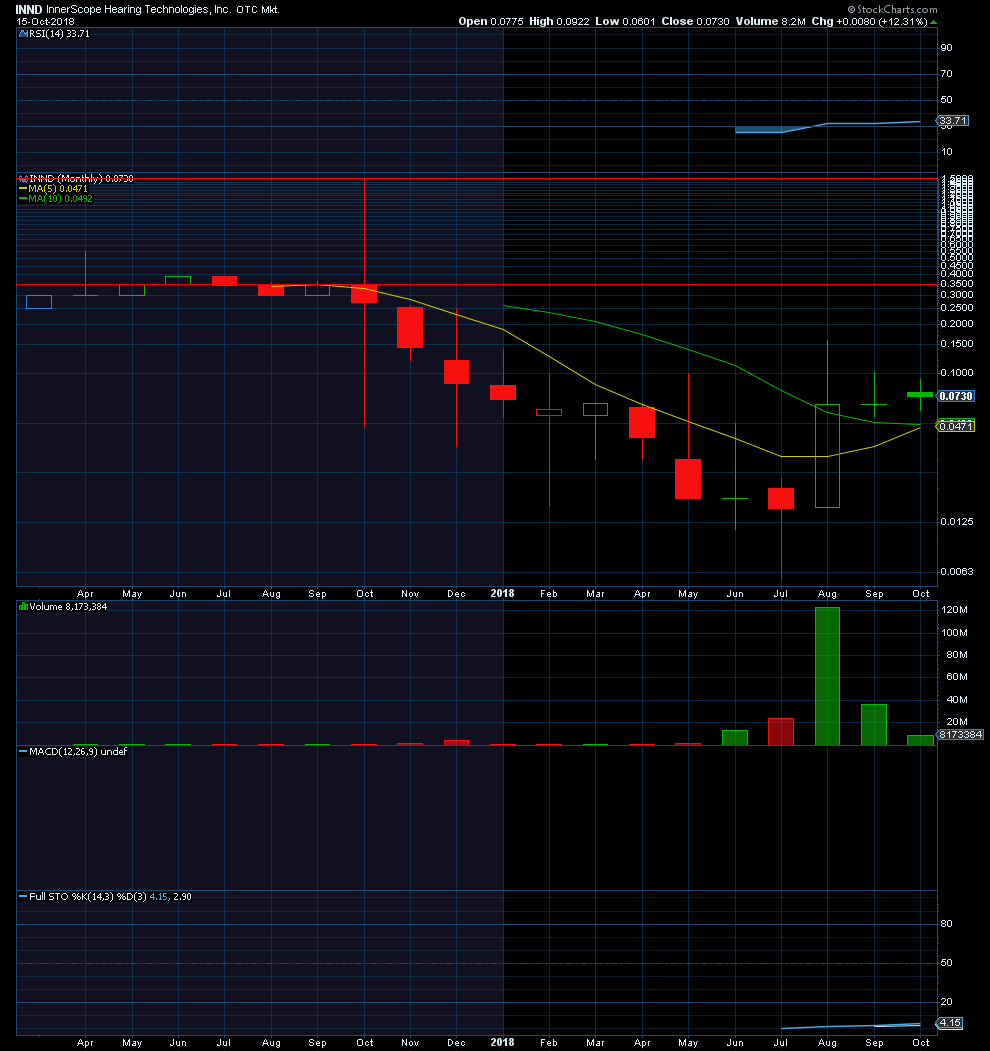
$INND Monthly chart ... $0.35 and $1.50 seem like good short and long term targets. There are many resistances in between of course. The 5 MA is about to cross 10 MA - very bullish long term chart.
(1)
(0)
Newer
Older