(Total Views: 154)
Posted On: 07/11/2018 1:52:24 PM
Post# of 85627

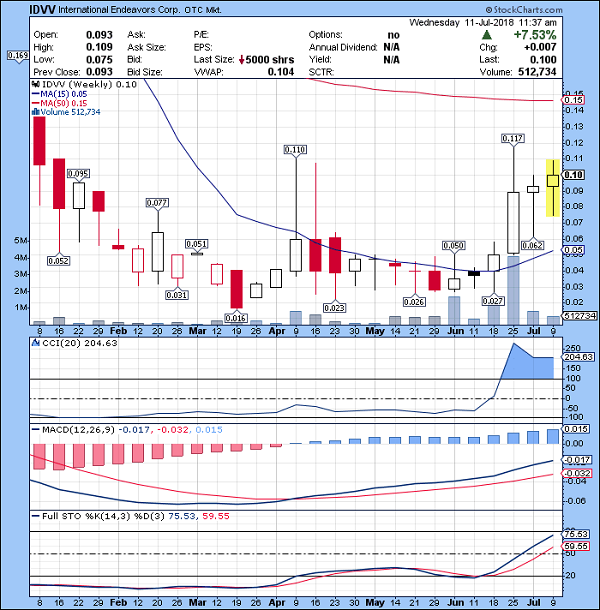
The $IDVV weekly chart looks great with the 15MA moving up sharply.
The price to beat for an even better looking chart is resistance at .11 and .117
When it breaks above that, the next move North should take it to the 50MA at .15
The price to beat for an even better looking chart is resistance at .11 and .117
When it breaks above that, the next move North should take it to the 50MA at .15