(Total Views: 258)
Posted On: 05/03/2018 6:46:48 PM
Post# of 109141
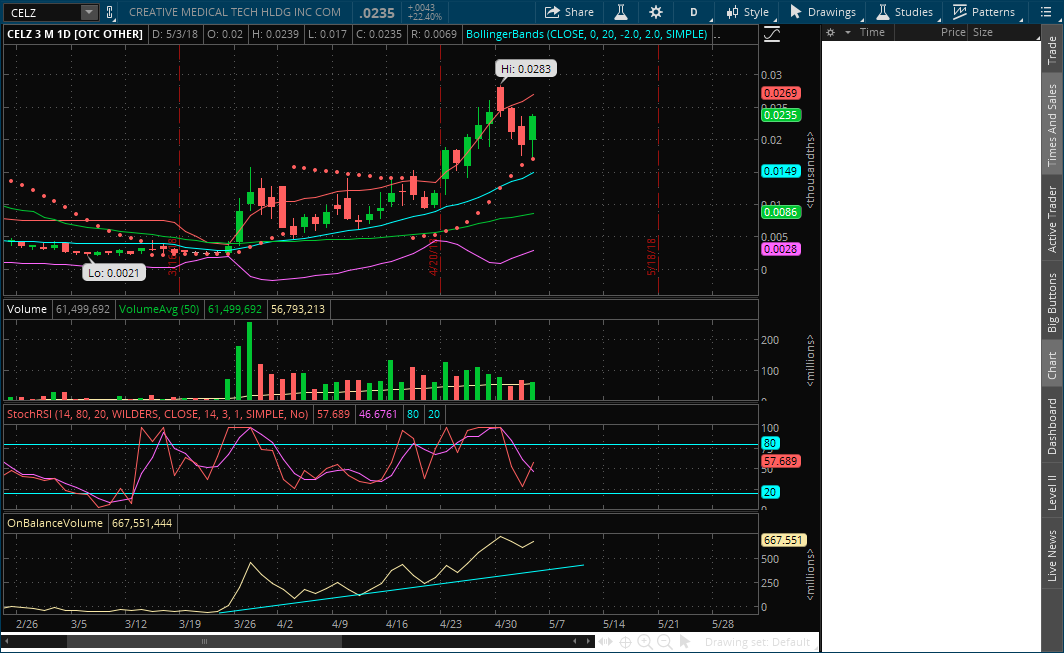
For all the chartists on the board...take a look at this and let me know what you think.
The following chart is for CELZ. I'm seeing a 3 black crows pattern that formed on Mon, Tues, Wed. Today we got a confirmation candle that the pattern is signaling a continuation as opposed to a bearish reversal since the close of today was higher than yesterday's close.
What gives it weakness...lower low than yesterday. not closing above yesterdays high.
What gives it strength...higher close than yesterdays close, closed even with yesterdays high, volume was substantial. Let me know if you think I understand this or if I'm full of s**t. TIA
All posts reflect my ignorance and opinions and should be regarded as such. I am first and foremost on a spiritual journey and trading is just a game. The money is only for keeping score.