(Total Views: 2386)
Posted On: 09/02/2017 2:10:43 PM
Post# of 2561

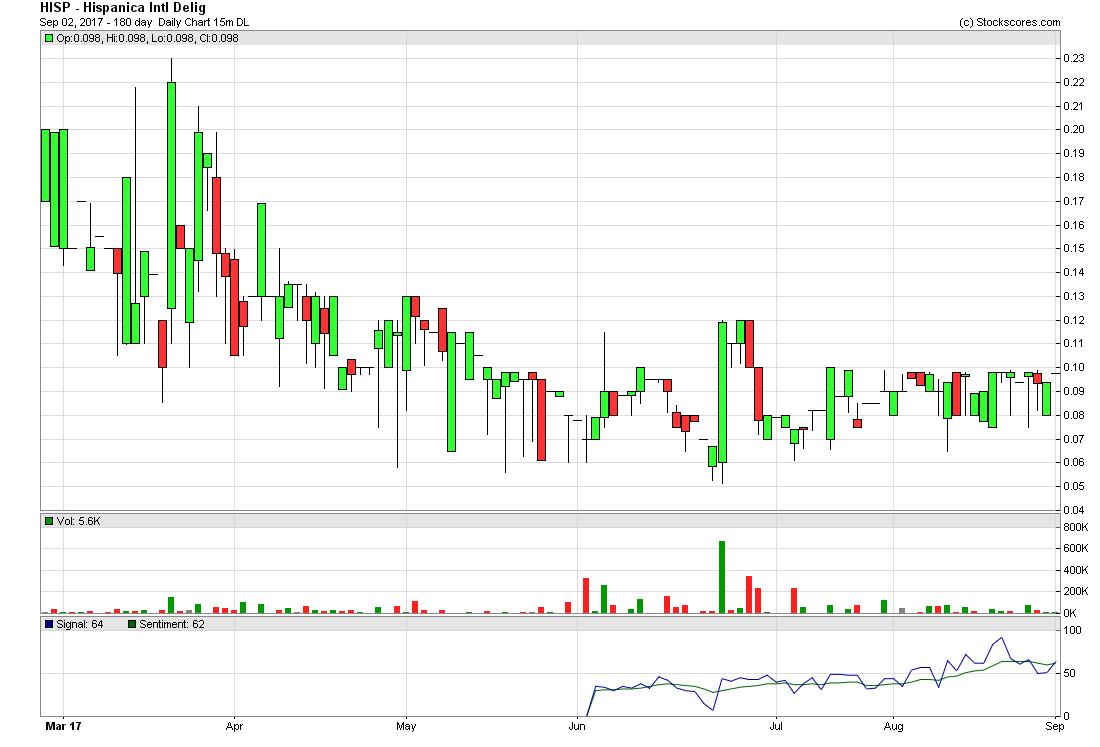
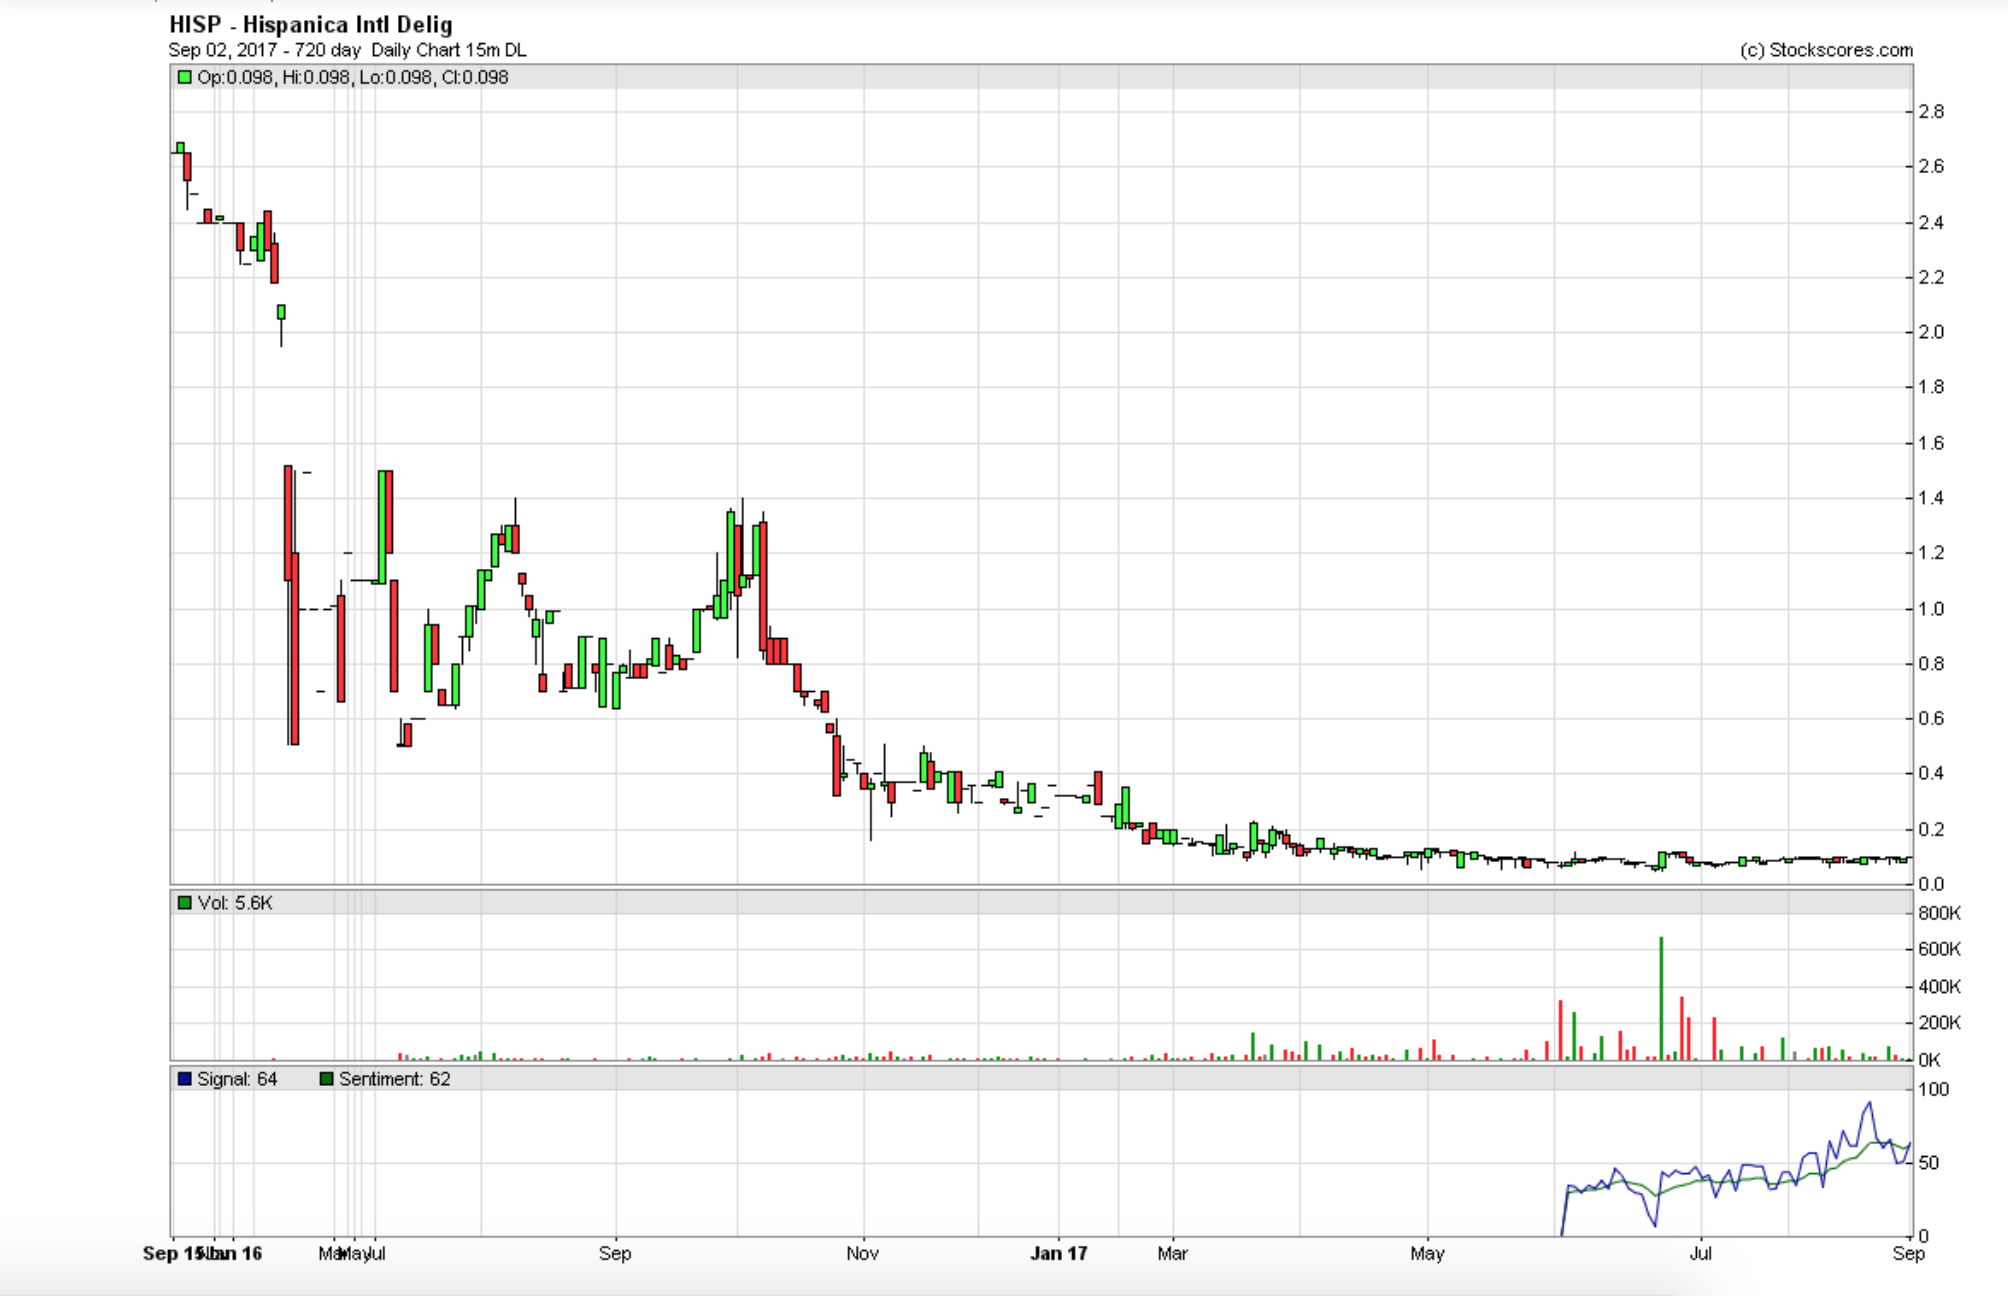
$HISP Daily Chart ~ Two+ Months of Accumulation Just About Over
Hispanica is a longer term investment as management appears to be executing on their business plan despite a few missteps in the past. We began accumulating HISP in the .05s in June. After an initial move to .12, the stock retraced to the .06s and the accumulation phase began. Over the last few weeks, the stock is getting more difficult to get on the bid as it's been channeling in the .08-.098 range. We've been bidding for almost 100,000 shares the entire last week at .08 and .0825 with very little selling to us. One can see on the chart below that a break above the .10 level and then the .12 could bode well for a technical breakout to the upside and possibly into the .20s. As management continues to execute and turn to anticipated profitability in their FY 2018, which began on June 1, the stock could return to levels not see since early 2016.
I have two charts below. The first is a six month chart while the second is a two year chart. Please note where the stock came from during some management missteps in late 2015/early 2016. In my opinion, those errors have been corrected. Revenues for FY 2018 should increase to $8MM per company discussions. GLTA


