(Total Views: 242)
Posted On: 06/11/2017 8:14:42 PM
Post# of 108739

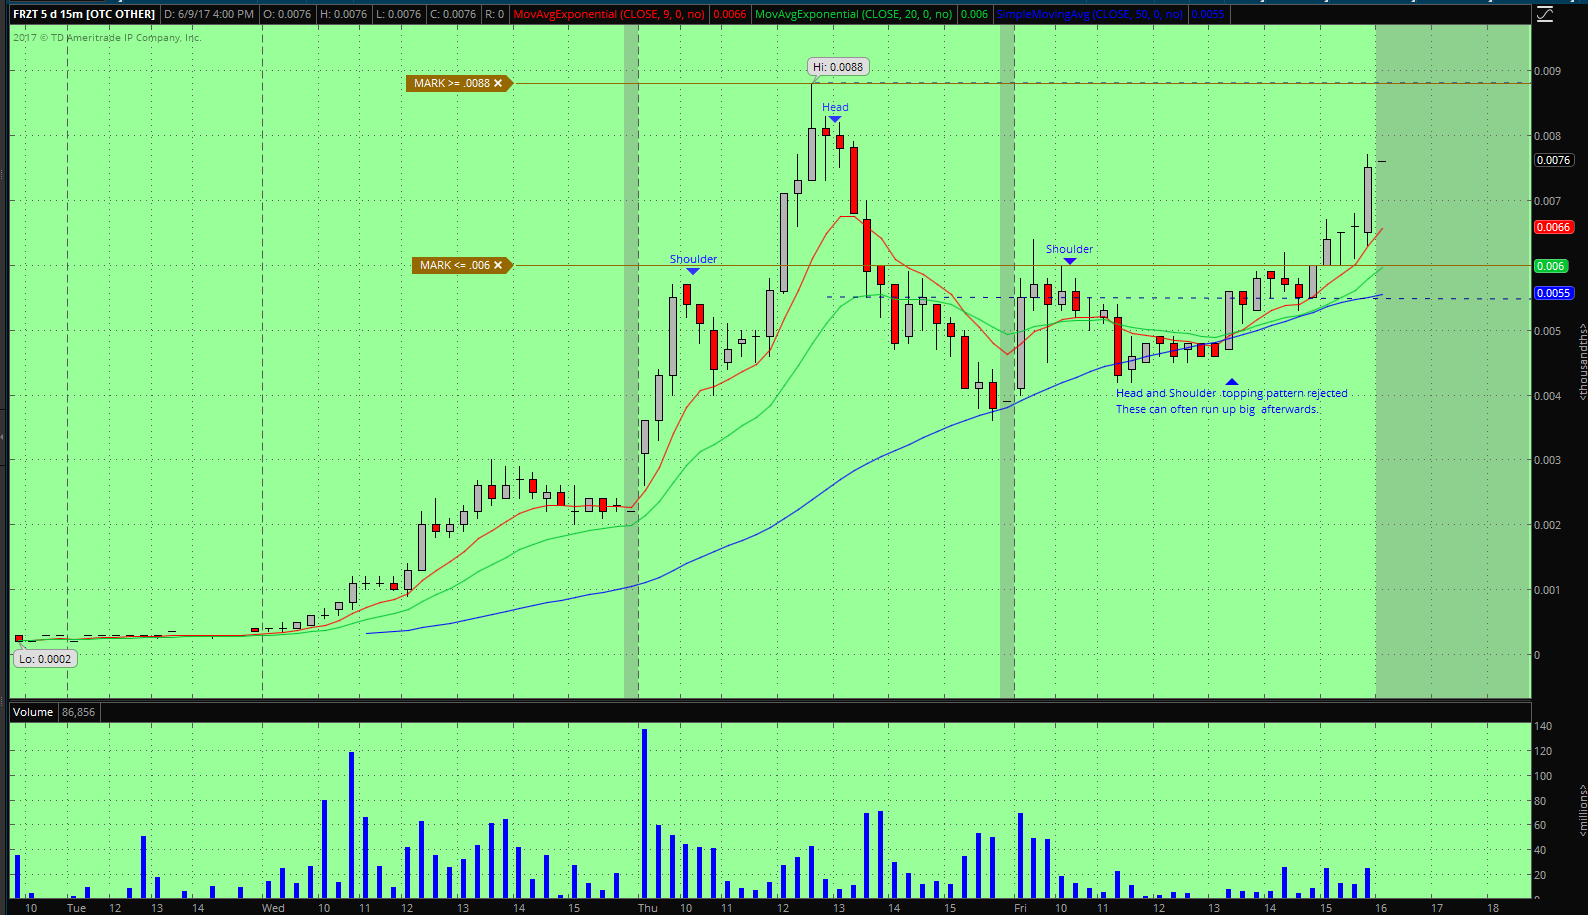
$FRZT is obviously extended,BUT...it had a head and shoulders topping pattern on the 15minute chart that was rejected. When H&S topping patterns fail to execute, they can run up pretty big. The Nasdaq did this on the daily from Aug to Nov 2016, then ran to all time highs. Similar topping pattern rejected, but different time frame. Anyway, here is the 15min chart for FRZT that I am talking about:

I do have a position in this, I took it about 1/2 hour before the close on Friday, when chasing like this I use the 9ema on the hourly as my stop. That is the red line on the chart just under the last candle bar. I may give it as low as the .006 level will see how the price and volume action is developing. I am expecting a test of the highs at .0088 and probably better. GL all!!
Yes this was called out by Berkshire about 10,000% ago, I am just sharing how I plan to play it now.
The fruits of your success will be in direct ratio to the honesty and sincerity of your own effort in keeping your own records, doing your own thinking and reaching your own conclusions - Jesse Livermore
