(Total Views: 261)
Posted On: 06/11/2017 3:42:48 PM
Post# of 109225

Here is how I am looking at $BTGI on the daily chart:
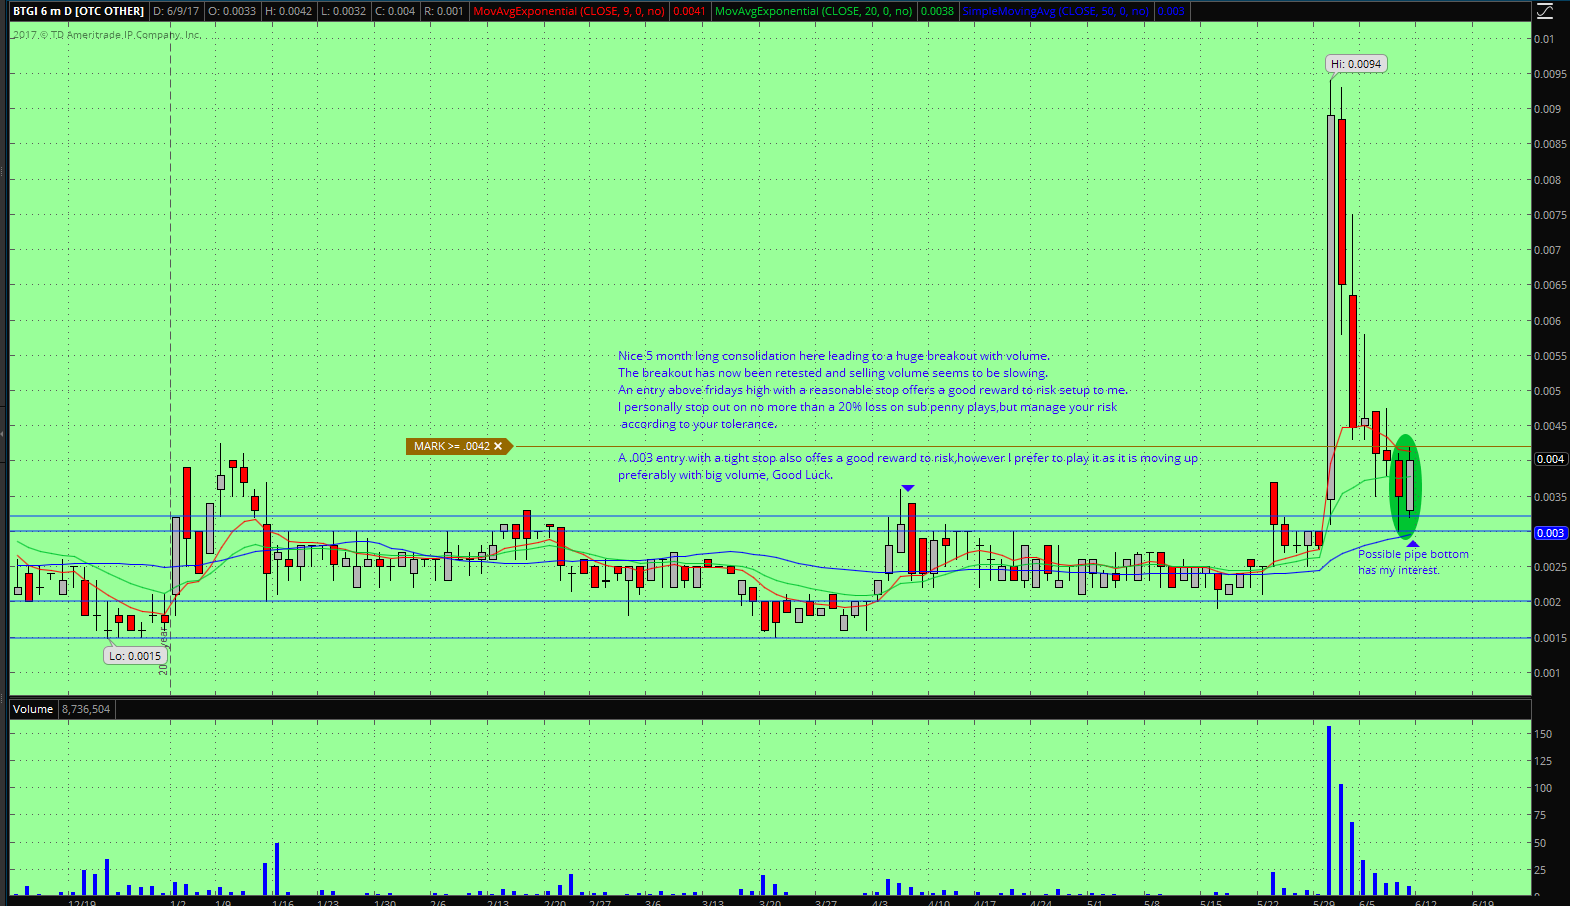
I like pipe bottom candle stick formations on the daily and weekly charts, they can be strong movers,but must confirm on the move above both candle highs. A stop on a move/close back below the previous highs offers a great reward to risk setup.
I do use the hourly as previously mentioned for a little tighter view, and also the 5minute when/if it's moving fast. GL!!
The fruits of your success will be in direct ratio to the honesty and sincerity of your own effort in keeping your own records, doing your own thinking and reaching your own conclusions - Jesse Livermore