(Total Views: 1779)
Posted On: 04/30/2017 7:08:14 PM
Post# of 2561

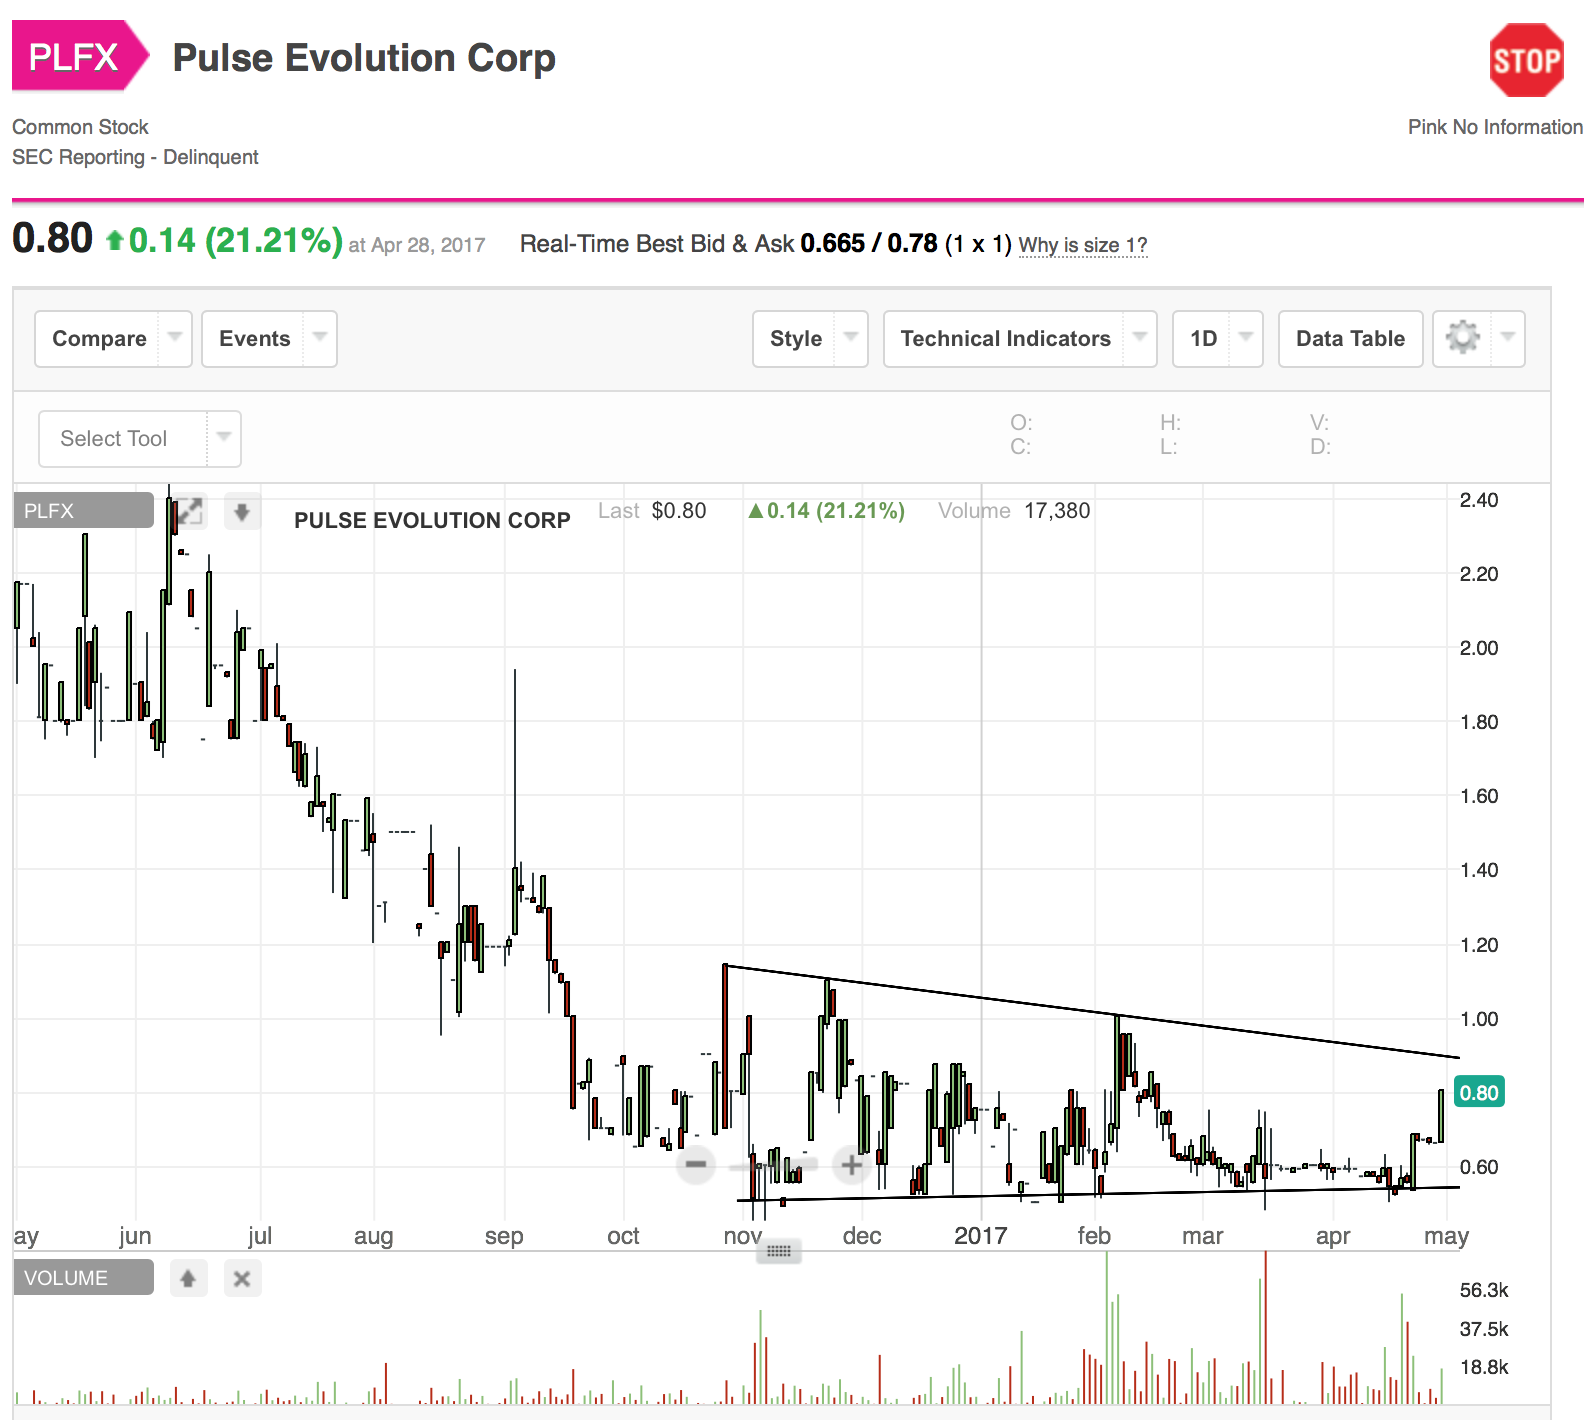
PLFX Daily Chart ~ Highest Close in Two Months
Rumors have it that PLFX Management just might be ready to begin releasing a lot of material information. As most here know, many of us have been accumulating the stock for months in the .50-.60s range. Average volume over the last 3-4 months has been approx 17,500, so not easy to build a large position in a week or two.
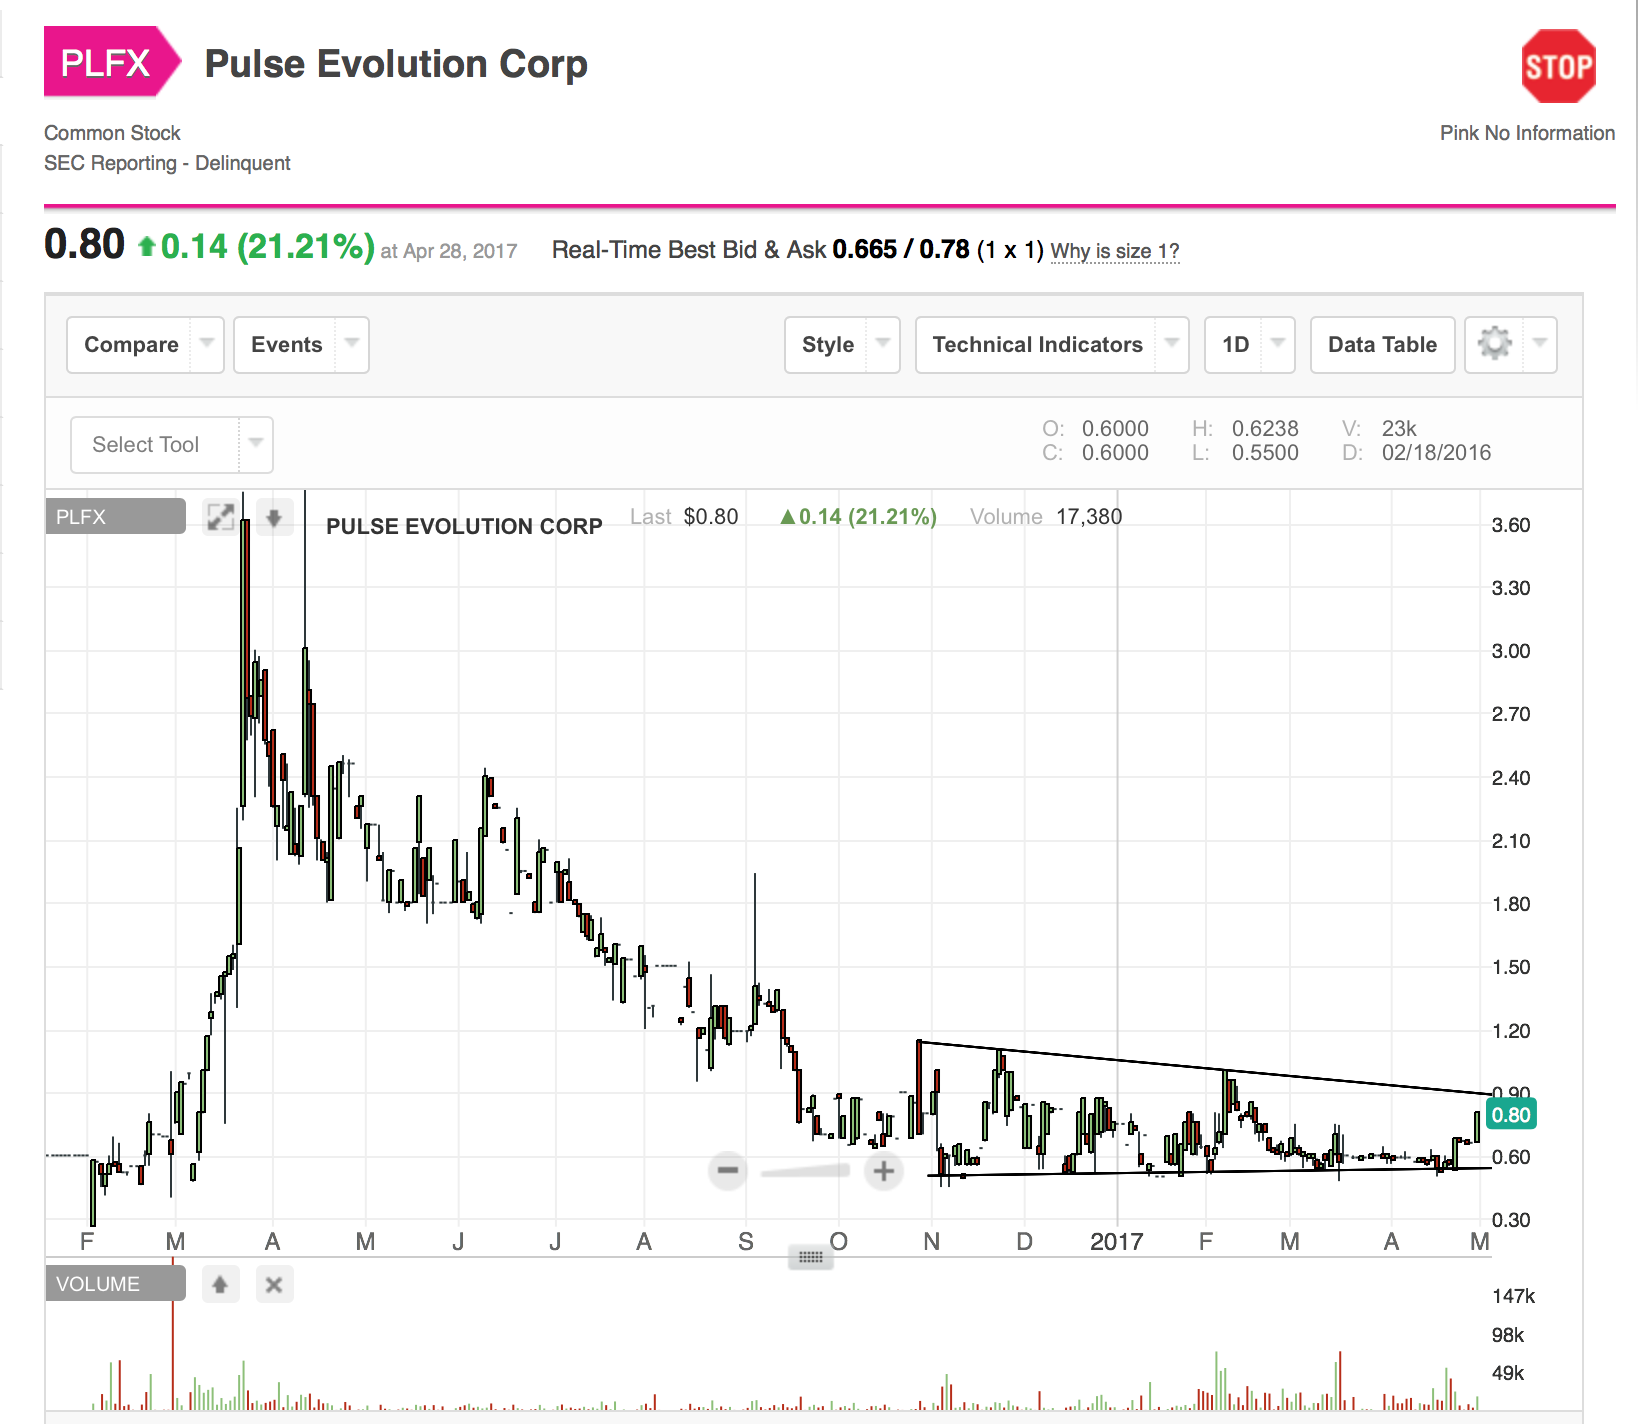
As one can see on the first chart, the last 1.5 weeks has seen the stock move from the low .50s to a close of .80 on Friday. On a technical basis, I'd like to see a break and close over the declining tops resistance line which is at approx .90. A move thru that level would bring into play a test of the previous high of 1.00 set back in February and then the 1.15/1.20 would be next up. Friday's average volume of 17K shares moved the stock 21.2% higher for the day. Could it be the consistent selling from older shareholders is finally over? We'll see shortly. It's my opinion, as one can read in previous posts on the board, that any solid releases could propel the stock to new highs, past the $3.70s seen in March 2016 (see second chart below). GLTA
Rumors have it that PLFX Management just might be ready to begin releasing a lot of material information. As most here know, many of us have been accumulating the stock for months in the .50-.60s range. Average volume over the last 3-4 months has been approx 17,500, so not easy to build a large position in a week or two.
As one can see on the first chart, the last 1.5 weeks has seen the stock move from the low .50s to a close of .80 on Friday. On a technical basis, I'd like to see a break and close over the declining tops resistance line which is at approx .90. A move thru that level would bring into play a test of the previous high of 1.00 set back in February and then the 1.15/1.20 would be next up. Friday's average volume of 17K shares moved the stock 21.2% higher for the day. Could it be the consistent selling from older shareholders is finally over? We'll see shortly. It's my opinion, as one can read in previous posts on the board, that any solid releases could propel the stock to new highs, past the $3.70s seen in March 2016 (see second chart below). GLTA