(Total Views: 1179)
Posted On: 04/02/2017 1:24:21 PM
Post# of 2561

SPDL Daily Chart ~ Up Nicely from .079
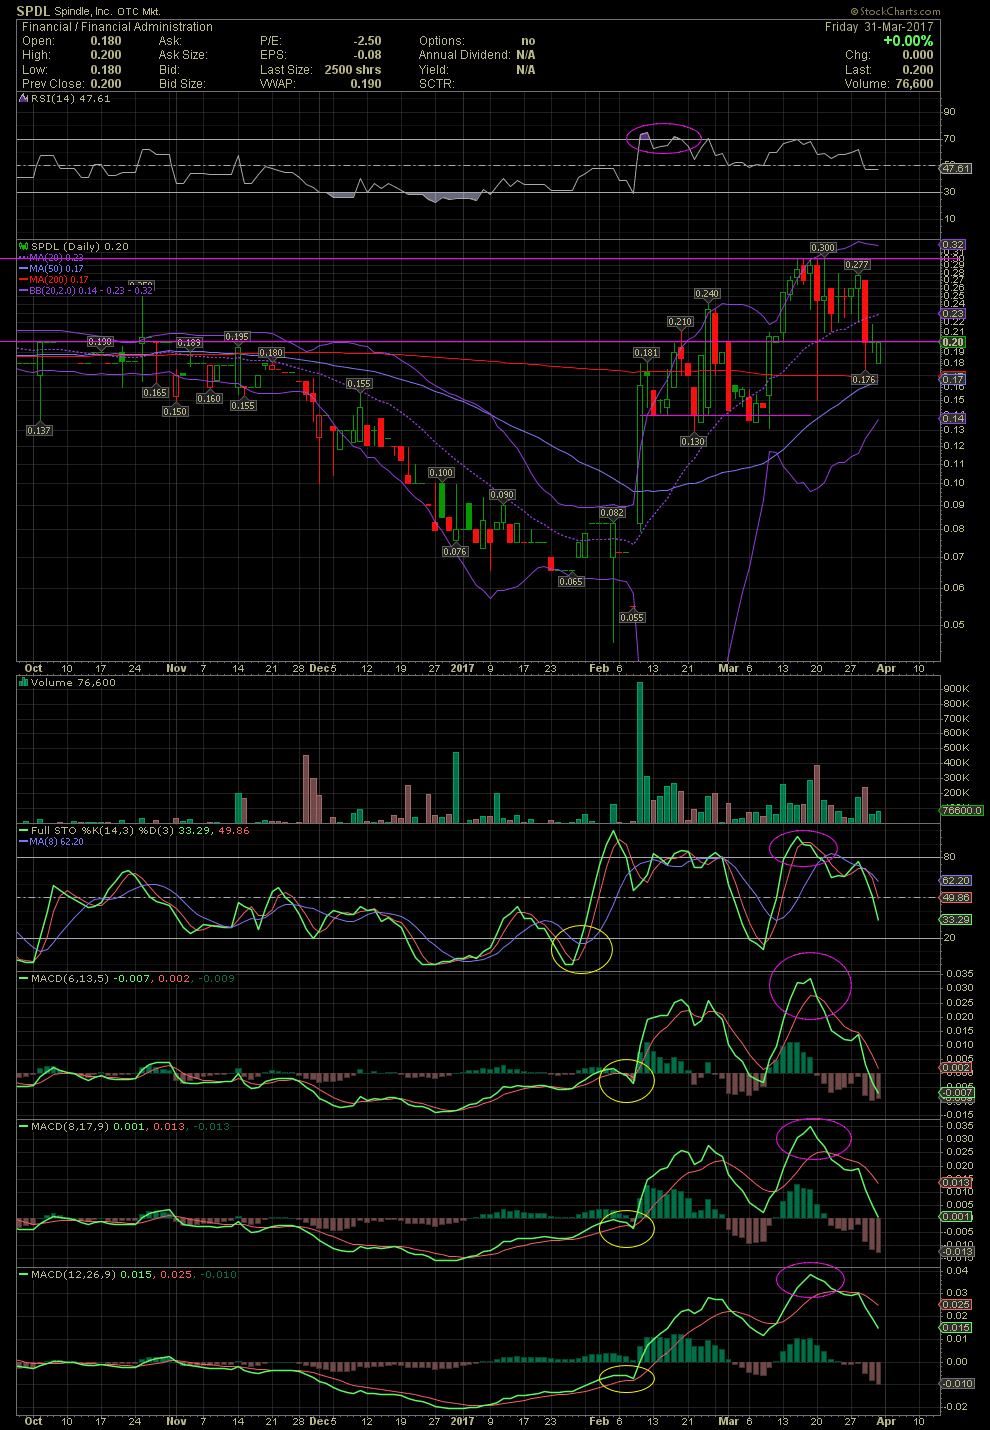
I shared SPDL on Feb 9 as a longer term investment. Over the last few weeks, the stock ran from .079 and hit the first horizontal resistance line at .20, which was a multiple top going back as far as mid July. As one can see on the first chart below, the stock then traded between .13 and .20 as the first group of short term traders and sellers were absorbed by investors. As the selling and volume receded into early March, the stock then began another leg to the upside, hitting .30, the next horizontal resistance point. As the technical indicators moved into overbought levels, the stock pulled back to its support level of .20 which was previously resistance. The indicators over the last two weeks have dropped and initiated a reset prior to the next leg up. As with the first run from .079 to .20, the recent pullback from .30 to an intraday low of .18, the longer term investors are absorbing the short term sellers once again.
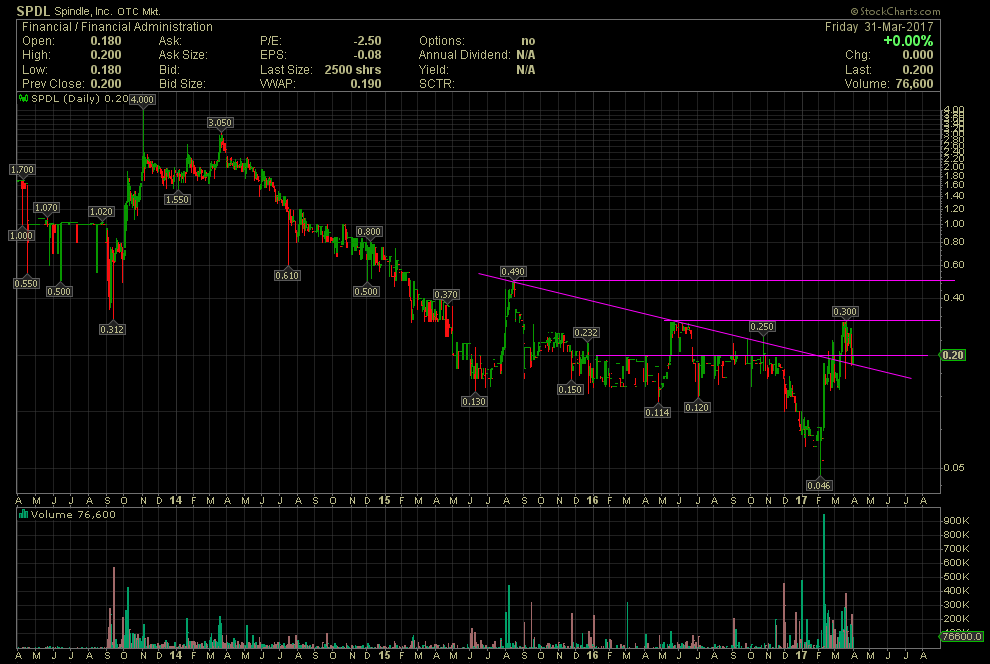
One the second chart, one can see the first two horizontal resistance points along with the next upside target once the stock breaks above .30. Should management execute, it's easy to see very little in the way of a potential move into low dollars should the previous high of .49, set in Aug 2015, is taken out. Now we need financials, 8Ks and the anticipated news flow. GLTA


