(Total Views: 1434)
Posted On: 02/09/2017 7:44:41 PM
Post# of 2561

SPDL Four Year Chart..............
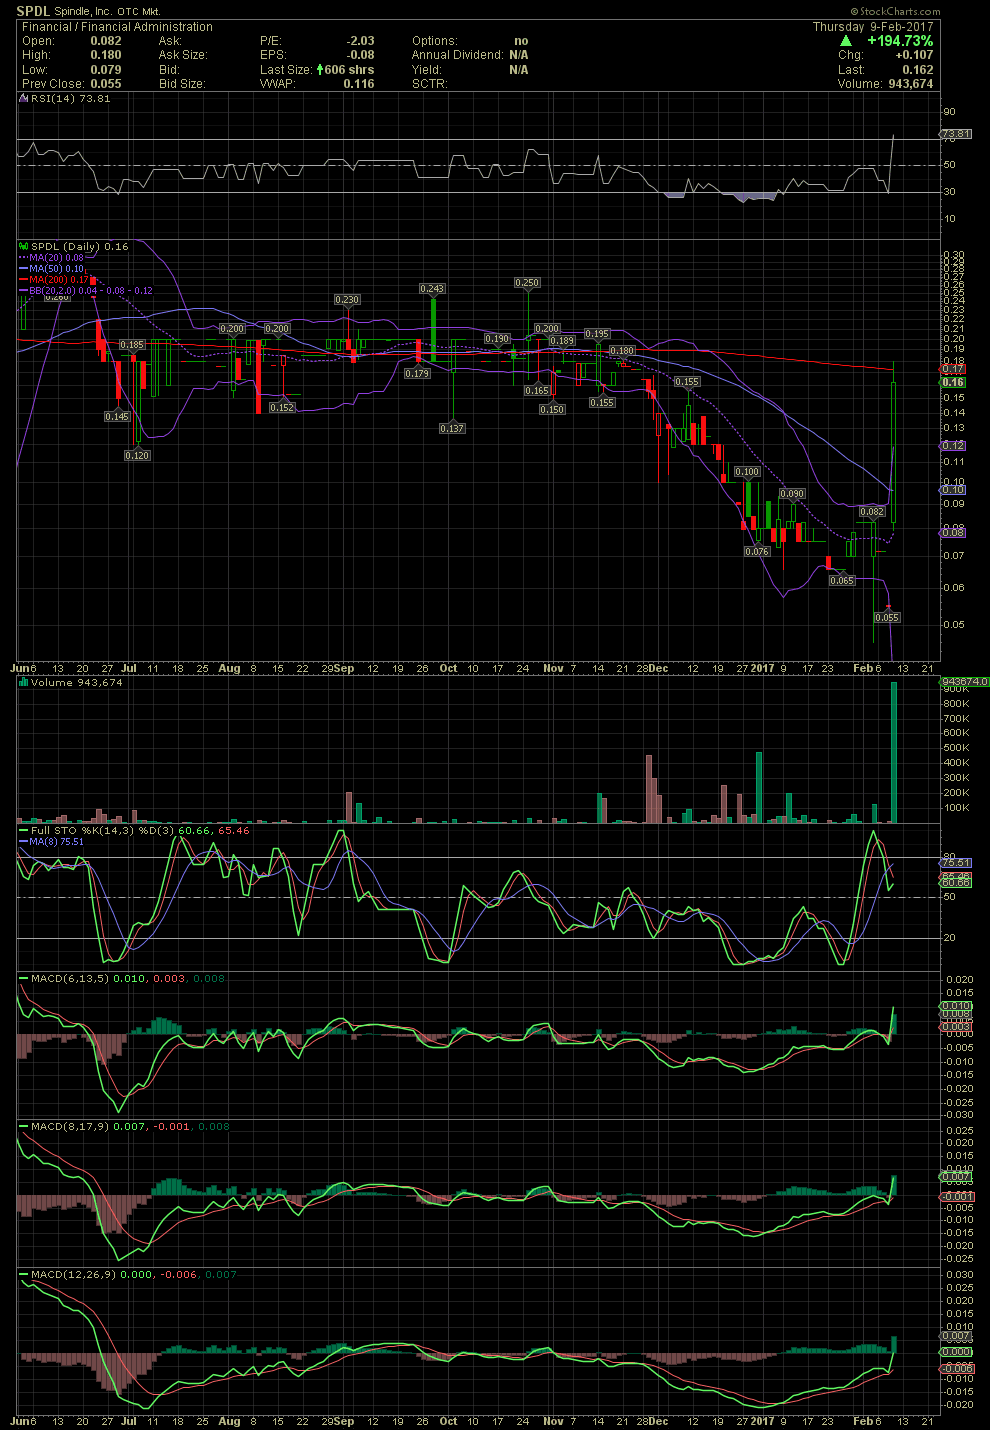
As one can see on a longer term chart below, today's volume was record volume for Spindle. Next stop is the mid .20s-.30, and then .49. Should the stock break thru these price targets, a return to $1.00+ is certainly in the picture. GLTA
As one can see on a longer term chart below, today's volume was record volume for Spindle. Next stop is the mid .20s-.30, and then .49. Should the stock break thru these price targets, a return to $1.00+ is certainly in the picture. GLTA