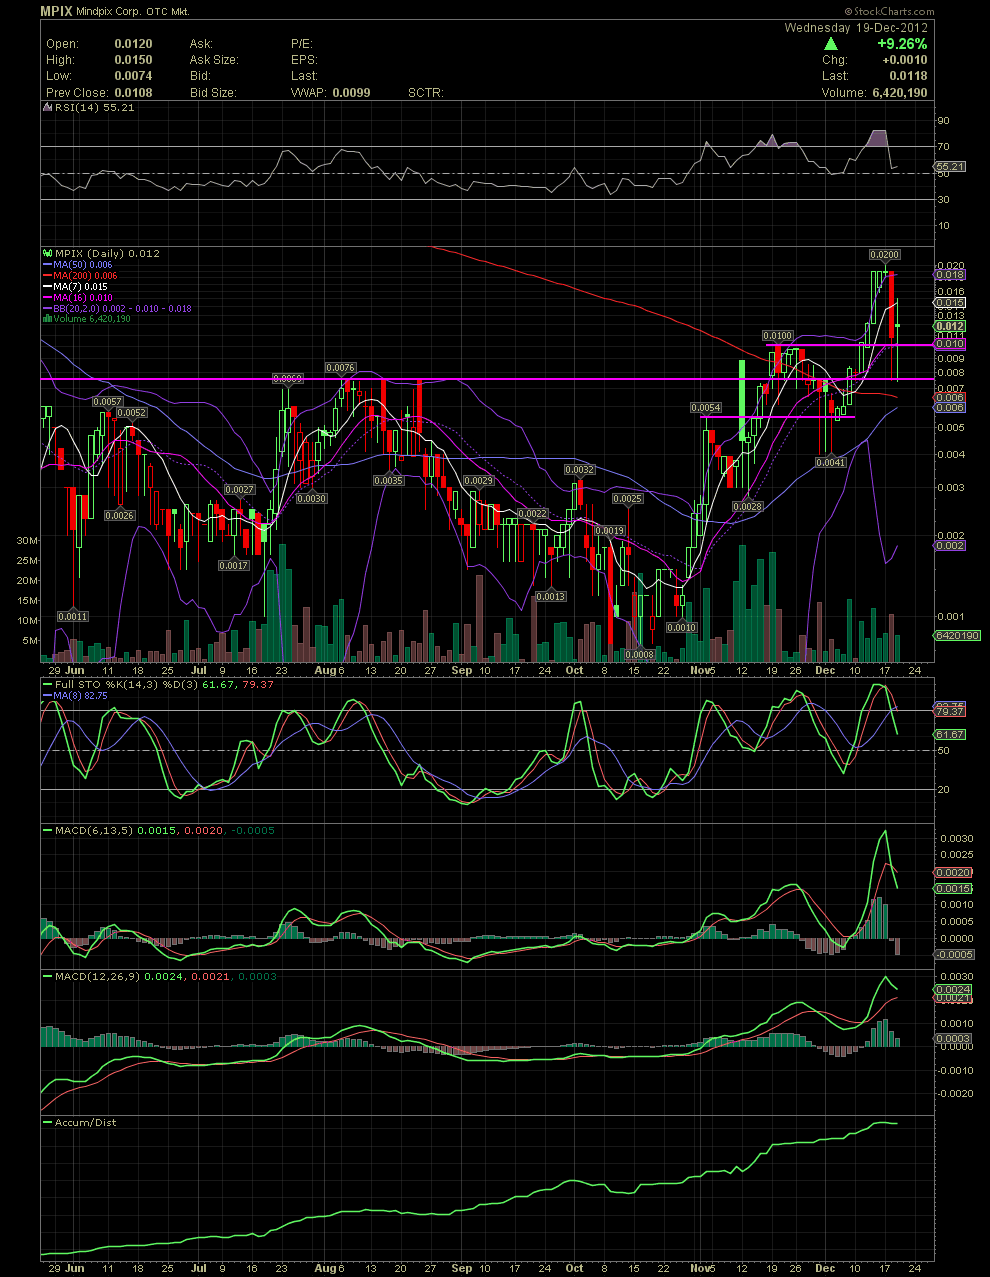
MPIX Daily Chart.......... Day 2 of the Current Correction
A quick look at the chart shows day #2 of get correction. Pretty much a repeat of last night's update. MPIX's pullbacks over the last couple of months, have lasted from 4 to 6 days. The long tails of the candles yesterday and today show the intraday lows and the subsequent rallies off those lows. Today was a day minor tug of war between the sellers and the longs. The stock ended up 9.26% for the day although just below the opening price. My guess would be a bit more consolidation to go unless some strong news is released that would bring in some strong buying.
Two days ago, the RSI, as well as all the other indicators on this chart, were very overbought. The RSI held the 50 line today, as it did during the early December pullback. The FullSto and faster MACD are rapidly falling from their overbought conditions. I would like to see the FullSto hold just above its 50 line. And the longer term MACD is also correcting but since it's a slower setting that the other MACD, the correction there isn't as pronounced. As with yesterday's trading, the intraday low for the day was just under the .0076 support zone. The close of .0118 was just over the support line of .01 while also closing above the MA 16 and 20. For those that like the Golden Cross event, you will see that occur in another two days. I believe I made mention of it about two weeks ago. I said it would probably take a couple of weeks. I don't use the G.C. for anything as it's waaaaaay to slow. By the time the MA50 crosses the MA200, a lot of lost profit is normally missed. On the Big Boards, I do use it as a longer term trend indicator. Resistance points on the way back up on the daily would continue to me the MA7 sitting at .015. Oh! The high of the day today was .015. Go figure. Once the stock price gets thru .015, the .019/.02 top will be the next resistance to get thru. GLTA

