Posted On: 09/28/2016 11:58:28 PM
Post# of 2561

TNTY Daily Chart ~ Initial Reversal Underway
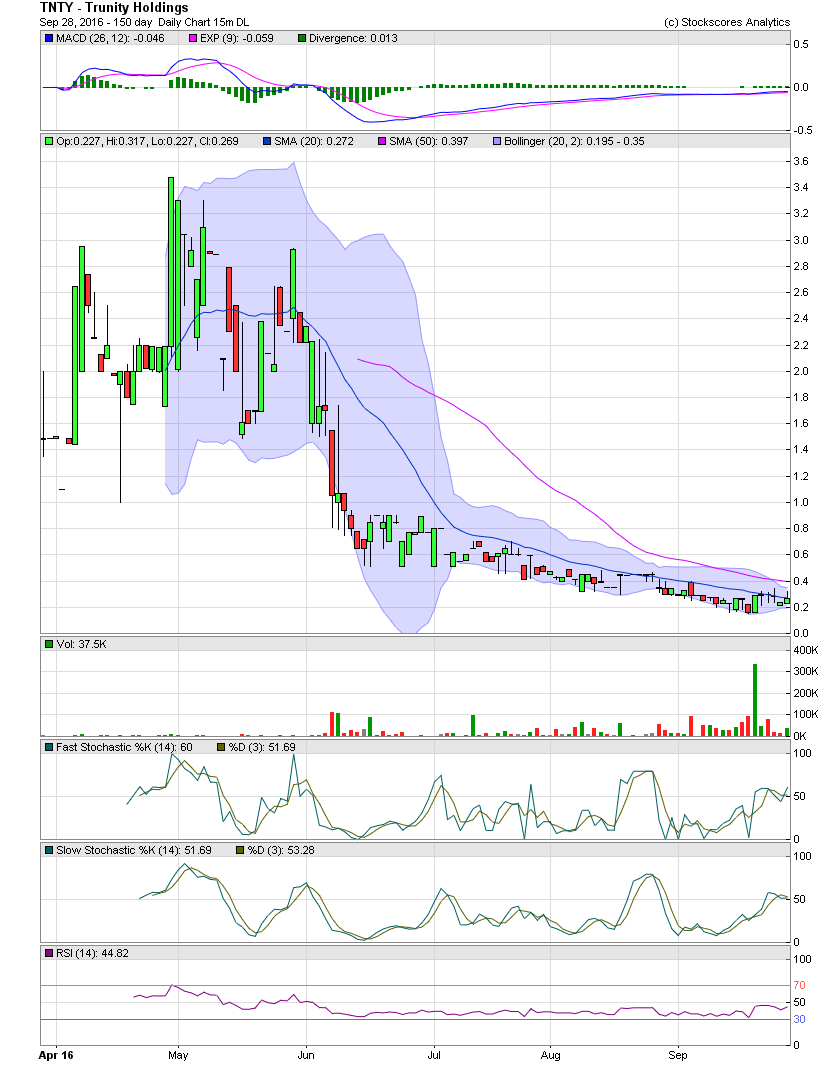
TNTY is getting ready to break over its MA20 which hasn't been seen since late May. As I mentioned a few days ago, a few of us began accumulating TNTY one day prior to the huge volume spike just over a week ago. Since then, the stock has appreciated from an intraday low of .155 to just above .34 and trending below the MA20 at .272. The technical resistance on the way back up should be fairly light. The bollie bands are pinching, and although that doesn't foretell which direction the stock will move, the balance of the indicators suggest to me that it will move sharply to the upside shortly. GLTA

TNTY is getting ready to break over its MA20 which hasn't been seen since late May. As I mentioned a few days ago, a few of us began accumulating TNTY one day prior to the huge volume spike just over a week ago. Since then, the stock has appreciated from an intraday low of .155 to just above .34 and trending below the MA20 at .272. The technical resistance on the way back up should be fairly light. The bollie bands are pinching, and although that doesn't foretell which direction the stock will move, the balance of the indicators suggest to me that it will move sharply to the upside shortly. GLTA

