Posted On: 06/26/2016 11:20:36 AM
Post# of 1705

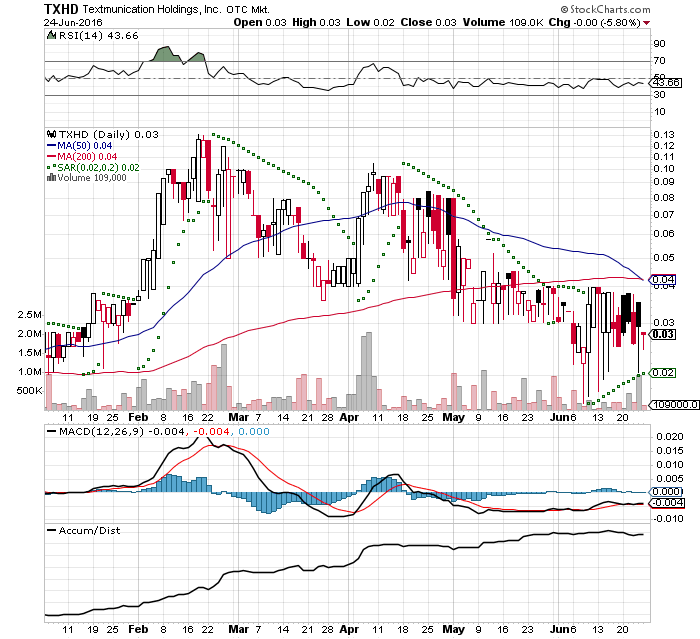
TXHD Daily Chart with A/D line
Positives on this chart is strong accumulation as can be clearly seen on the A/D line. There is strong support at 0.02, 0.01 and 0.005. Resistance is at 0.04, 0.06, 0.08 and .135. Weekly chart resistance is at 0.038.
Only Negative is the Death Cross occurring on the daily. Weekly chart still very bullish so strong buying could allow for 50ma to bounce off 200ma to avoid the bearish down cross.
My Favorite plays are on the Nasdaq DIP and RIP Board http://investorshangout.com/NASDAQ-DIP-and-RIP-87909/
My Favorite Paid chat room with amazing chart setups is The Trading Stock Lounge http://www.thetradingstocklounge.com/
My Favorite Paid chat room with amazing chart setups is The Trading Stock Lounge http://www.thetradingstocklounge.com/