Posted On: 06/15/2016 6:38:51 PM
Post# of 2561

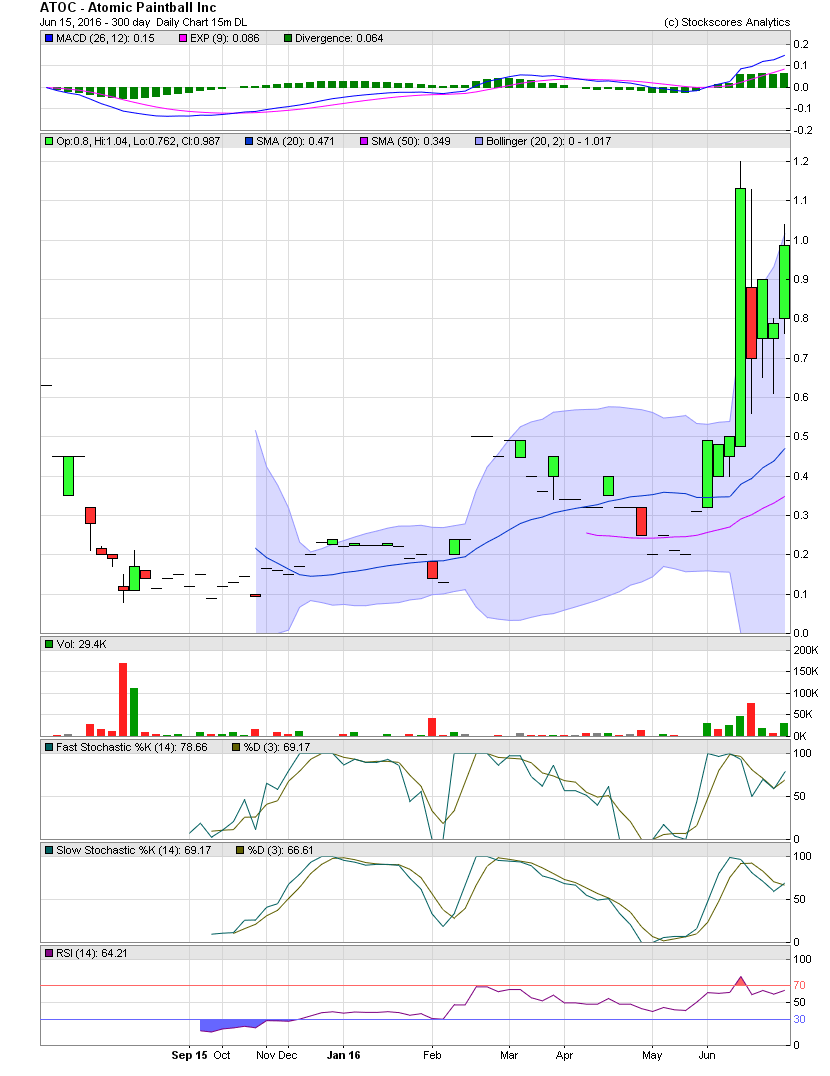
ATOC Daily Chart ~ Proceeding as Hoped For......
As hoped for, the one day spike that took ATOC from the .40s to 1.20, saw a pullback. Almost always, as I mentioned within my previous ATOC post http://investorshangout.com/post/view?id=3814728 the wise thing to do would be to wait for a pullback. The correction occurred, the selling dried up and now from .57 back to 1.00. As you also might note, the candles are back within the bollie bands. What's outside the bollies, always returns to within the bollies, always. The RSI and both Fast and Slow Sto have also reset a bit from overbought levels. Leg 2 to the upside appears to have started. With a calculated and measured move, the chart is projecting a possible move to the $3-$4 level over the next few weeks. We'll see how things develop. GLTA
As hoped for, the one day spike that took ATOC from the .40s to 1.20, saw a pullback. Almost always, as I mentioned within my previous ATOC post http://investorshangout.com/post/view?id=3814728 the wise thing to do would be to wait for a pullback. The correction occurred, the selling dried up and now from .57 back to 1.00. As you also might note, the candles are back within the bollie bands. What's outside the bollies, always returns to within the bollies, always. The RSI and both Fast and Slow Sto have also reset a bit from overbought levels. Leg 2 to the upside appears to have started. With a calculated and measured move, the chart is projecting a possible move to the $3-$4 level over the next few weeks. We'll see how things develop. GLTA