Posted On: 06/09/2016 11:08:05 AM
Post# of 2561

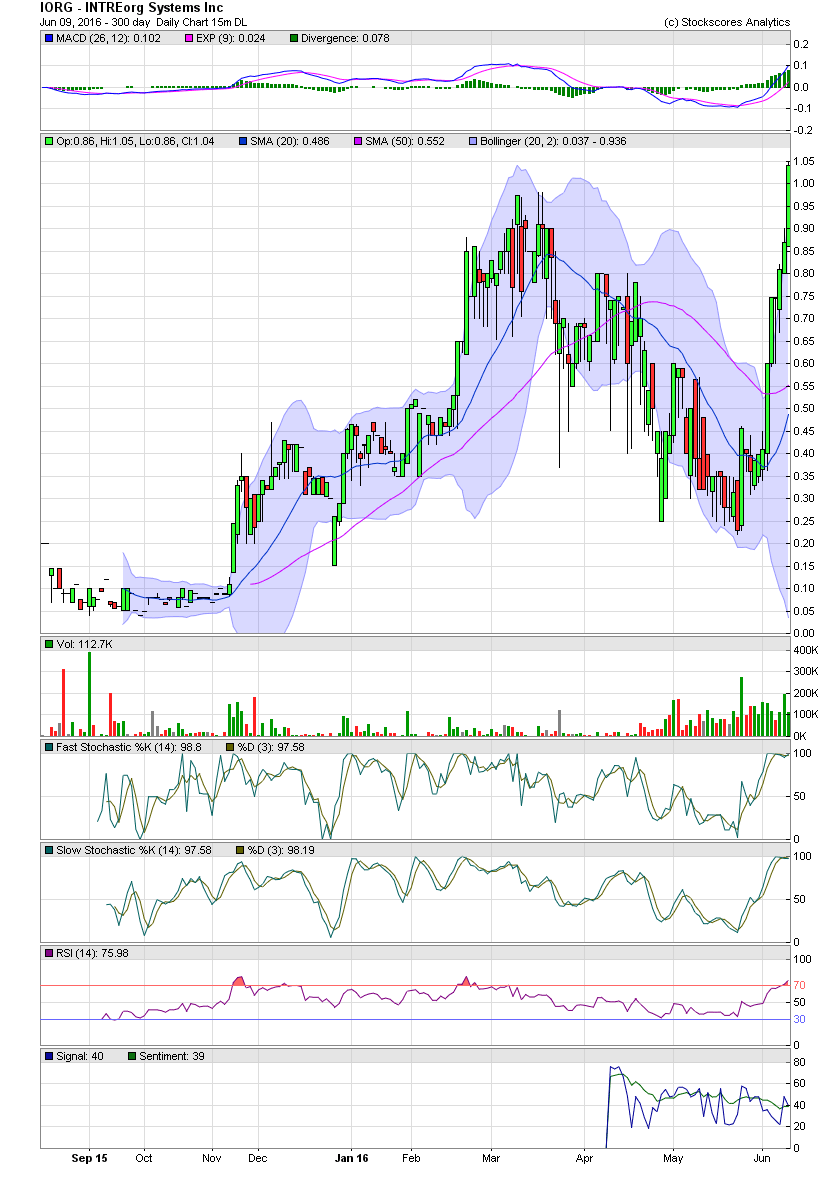
IORG Daily Chart ~ Highest Trading Since July 2011
IORG just began trading over $1.00. That is the highest level since July 2011. Three weeks ago, the stock traded as low as .22 when the chart reset. Although not a technical play, I'm sure a few eyeballs from The Hangout are now following along. My few posts and charts on the company over the last few weeks has seen as many at 1200 'Most Viewed' when I put a post up. Next short term target would be the 1.50-1.65 levels, which are the all time highs.
For those following along, in my opinion, for those with a 6 month horizon, the stock is by now means 'expensive'. I added a lot more today with friends. GLTA

