Posted On: 03/13/2016 5:19:30 PM
Post# of 2561

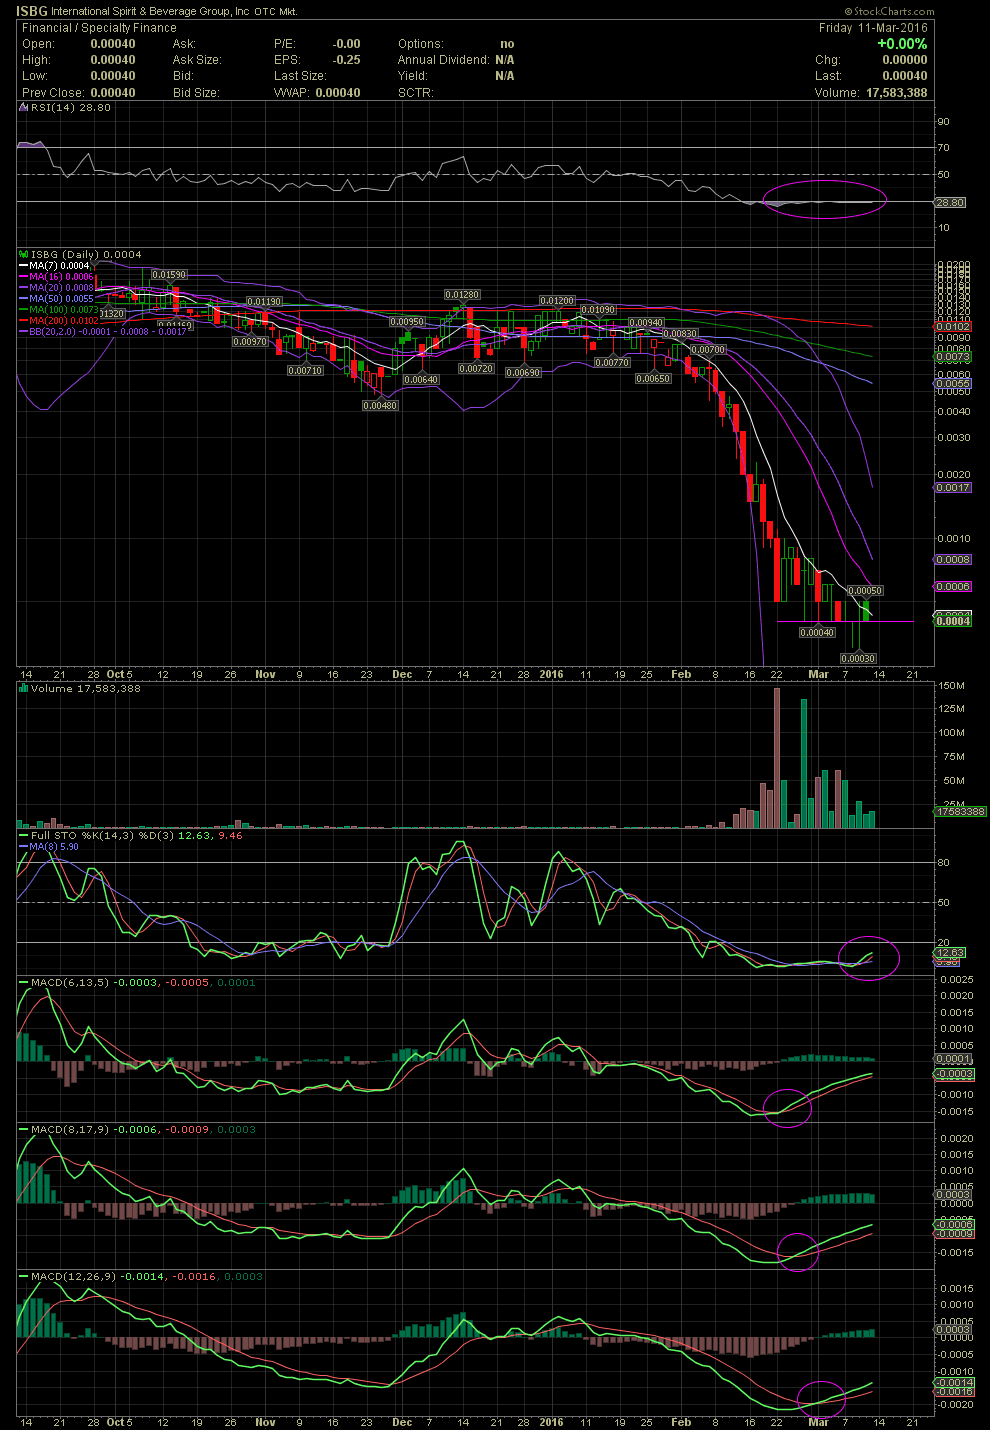
ISBG Daily Chart ~ Debt Conversion Completed?
After more than one month of huge volume and a dramatic decline, imo ISBG is at a bottom. A few of us accumulated well over 50MM shares over the last couple of weeks in the .0004/.0005 level. There were daily T trades after hours and many times numerous T trades during the trading days. Currently, one can see the RSI in an oversold level. That's an import level when one begins to enter a stock. Additionally, look at the levels of the FullSto and MACDs as they have fallen into very oversold territories and beginning and actually initiating positive crossovers. Although still well under the MACD zero lines, positive divergence to the upside can be indicative of a reversal. The .0004 level on the chart also appears to be holding for over two weeks now. So in using the technicals and the basing action of the stock at the .0004/.0005 area, many of us here chose to buy. Is this a guarantee of a low? No. Is it better to enter now with the indicators in overbought levels than in overbought areas? Yes. I'll be adding more this week. GTLA
After more than one month of huge volume and a dramatic decline, imo ISBG is at a bottom. A few of us accumulated well over 50MM shares over the last couple of weeks in the .0004/.0005 level. There were daily T trades after hours and many times numerous T trades during the trading days. Currently, one can see the RSI in an oversold level. That's an import level when one begins to enter a stock. Additionally, look at the levels of the FullSto and MACDs as they have fallen into very oversold territories and beginning and actually initiating positive crossovers. Although still well under the MACD zero lines, positive divergence to the upside can be indicative of a reversal. The .0004 level on the chart also appears to be holding for over two weeks now. So in using the technicals and the basing action of the stock at the .0004/.0005 area, many of us here chose to buy. Is this a guarantee of a low? No. Is it better to enter now with the indicators in overbought levels than in overbought areas? Yes. I'll be adding more this week. GTLA