Posted On: 03/03/2016 5:49:40 PM
Post# of 2561

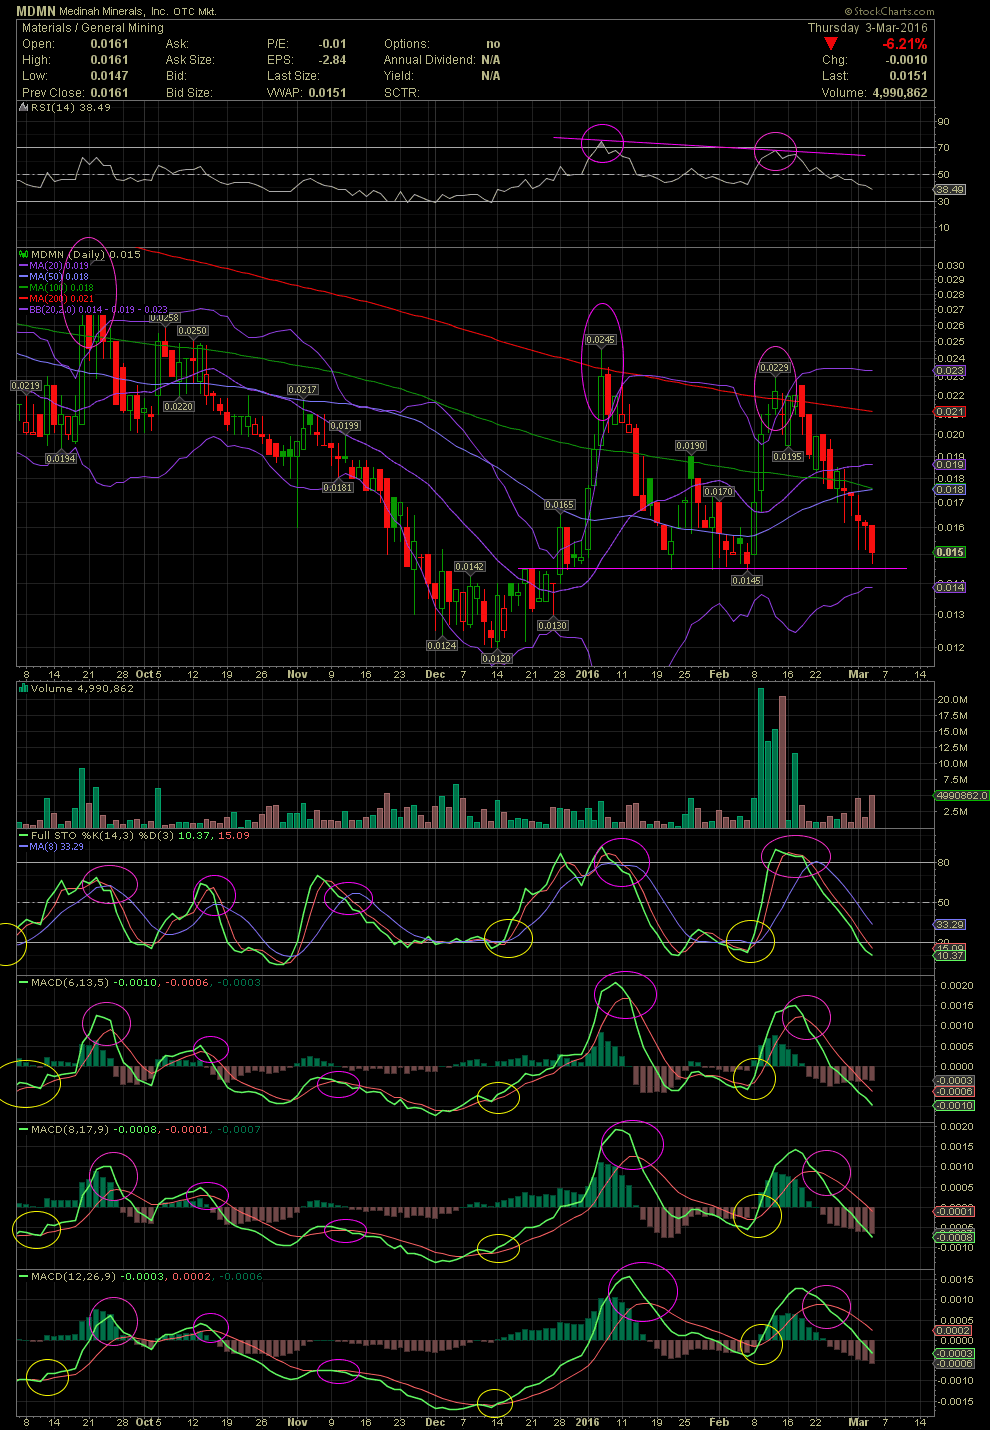
MDMN Daily Chart ~ Nearing The Support Line of .0145
Per a number of requests from the MDMN boys, here's a chart of MDMN. As always, please link back to previous charts and comments. As one can see on the chart below, MDMN has declined when the RSI set a lower high then the previous high. Although the stock didn't trade into the RSI 'Nose Bleed Zone' of 70+, there were plenty of other technical indicators to suggest a top was forming. Our exits from MDMN a few weeks ago, from as high as .0225s, has been logged as the seventh, straight, successful swing trade, although I didn't participate in the last run as I mentioned before. The FullSto and MACDs continue their divergence to the downside and appear to have quite a bit to go yet, barring any strong material news. The selling volume has creased over the last week, which is also a negative for the short term potential of a reversal. At this moment, the support line at .0145 may or may not hold. Only time will tell. If the .014s don't offer support, I believe the previous levels of mid December in the .012s will be seen. Those of us trading MDMN will wait for the technical reset as offered by the charts. GLTA
Per a number of requests from the MDMN boys, here's a chart of MDMN. As always, please link back to previous charts and comments. As one can see on the chart below, MDMN has declined when the RSI set a lower high then the previous high. Although the stock didn't trade into the RSI 'Nose Bleed Zone' of 70+, there were plenty of other technical indicators to suggest a top was forming. Our exits from MDMN a few weeks ago, from as high as .0225s, has been logged as the seventh, straight, successful swing trade, although I didn't participate in the last run as I mentioned before. The FullSto and MACDs continue their divergence to the downside and appear to have quite a bit to go yet, barring any strong material news. The selling volume has creased over the last week, which is also a negative for the short term potential of a reversal. At this moment, the support line at .0145 may or may not hold. Only time will tell. If the .014s don't offer support, I believe the previous levels of mid December in the .012s will be seen. Those of us trading MDMN will wait for the technical reset as offered by the charts. GLTA